Saurabh Kushwaha
Contents
Introduction
Humans always try to extend their limit of sensing the surrounding or a system, through different means of tools. Sensors are one of those tools which humans use to extend their limits of sensing. Now those sensor can use in the probes or in detectors to gather information or work on a certain activity. Science always fascinates me; the experiments, achievements, laws and possibilities assures me that there will be a future, full of amazing concepts. I enjoy the process of experiment and it allows me to learn. I try to develop tools which are operated hand operated as it supports the villagers who can't afford electricity costs. Few of my projects are hydraulic crane, color changing fountain, oil trapping filter, and creating fog in a bottle. Recently I discovered Arduino and sensors like LDR, Air pollution sensor,[1]. I have been spending my time to understand it and come up with new products.
Detector
A device for detecting the presence of electromagnetic waves or of radioactivity
Sensors
Basic
A Sensor is an electronic component, module, or subsystem whose purpose is to detect events or changes in its environment and send the information to other electronics, frequently a computer processor. A sensor is always used with other electronics, whether as simple as a light or as complex as a computer.
Simulation through Sensor
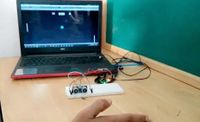
Simulating a situation through the help of a sensor is not kind of difficult, but when you have little information about Arduino and sensors then might yes, it’s kind of difficult because it’s my first time combining Unity with Arduino. As I wanted that my audience can able to play a video game without touching the keyboard. As I know how to make simple games on Unity, I decided to make my own game and then take a sensor and combine its input as a character controller. Ping Pong is one of those classic games which used to play a lot in 90s and we still love to play it. By using Unity, I make a replica of that game with some twist and as an input data I used Ultrasonic sensor. Ultrasonic sensor act like a Bat in the game, by bring the hand closer and further you can change the position of the bat for hitting the ball.
ECG Sensor
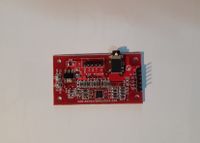
The AD8232,[2] is a neat little chip used to measure the electrical activity of the heart. This electrical activity can be charted as an ECG or Electrocardiogram. Electrocardiography is used to help diagnose various heart conditions.
Arduino Based ECG (Electrocardiography) sensor
Understanding the ECG
In general terms, lets look at what an ECG is representing and how we’re able to sense it. The ECG is separated into two basic Intervals, the PR Interval and the QT Interval,
PR Interval
The PR interval is the initial wave generated by an electrical impulse traveling from the right atrium to the left. The right atrium is the first chamber to see an electrical impulse.
QT Interval
The QRS is a complex process that generates the signature “beep” in cardiac monitors. During QRS both ventricles begin to pump.
Connecting the Hardware
Hardware :
1)Arduino Uno/Mega/Nano 2)ECG Module (AD8232) 3)ECG Electrodes - 3 pieces 4)ECG Electrode Connector -3.5 mm 5)Power supply 6)Connecting Wires
Software Requirement :
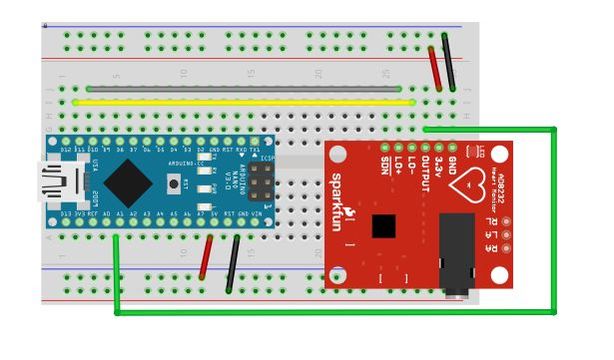
Arduino IDE Pin Connections Arduino 3.3V--------Sensor 3.3V pin
Arduino pin 10-------L0+
Arduino pin 11-------L0-
Arduino (A1)--------Output
Arduino Gnd --------Gnd
Connecting Headers to the Board
Follow the diagram below, to make necessary connections.
ECG-Arduino Circuit Diagram
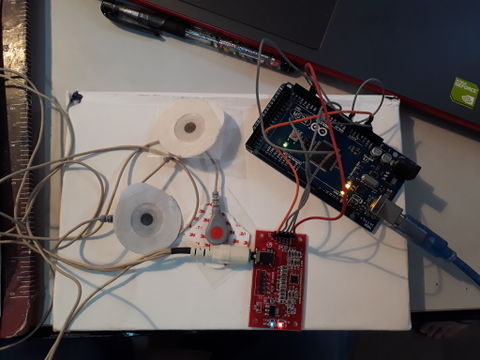
ECG-Arduino
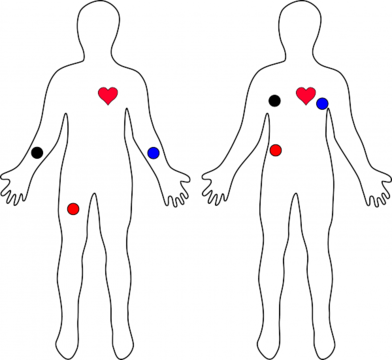
Typical Sensor Placements
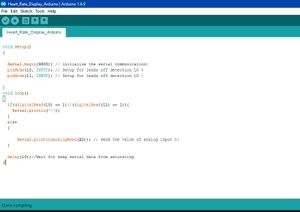
Uploading the Sketch
The example sketch can be found here [3].
Turbidity Meter
Turbidity is the cloudiness or haziness of a fluid caused by large numbers of individual particles that are generally invisible to the naked eye, similar to smoke in air. The measurement of turbidity is a key test of water quality.
Concept
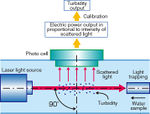
The turbidity of water creates a blockage for the light which passing through it. This deflection of light which passing through the sample water determines how much the water is clear.
Hardware Requirements:
LDR Sensor
Light Source (Laser Beam)
Resistor
Arduino
Connecting Wire
Cup
Bread Board
Software Requirement:
Arduino IDE
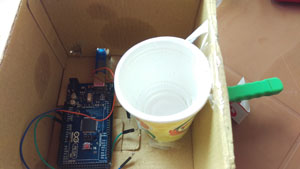
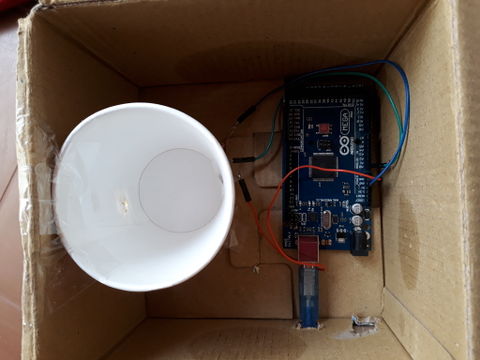
Construction Of Turbidity Meter
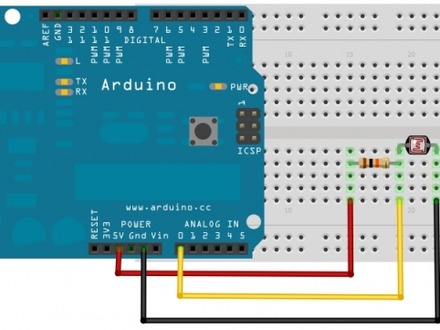
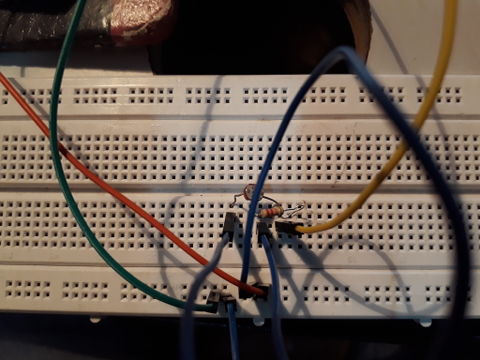
LDR Circuit Diagram
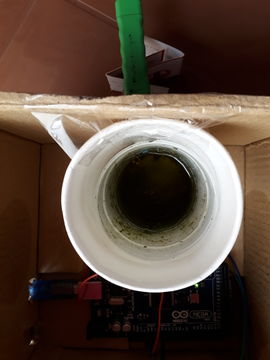
Turbidity Meter
LDR Sensor Connection
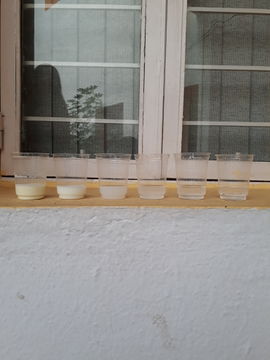
The solution Contain milk 1:10 water
Turbidity Meter
The Solution Contain Lake Water Sample
Arduino Program:
int sensorPin = A0; // select the input pin for ldr
int sensorValue = 0; // variable to store the value coming from the sensor
void setup() {
Serial.begin(9600); //sets serial port for communication
}
void loop() {
sensorValue = analogRead(sensorPin); // read the value from the sensor
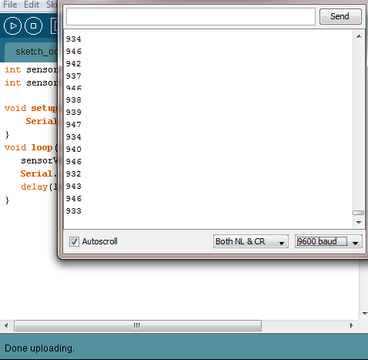
Serial.println(sensorValue); //prints the values coming from the sensor on the screen
delay(100);
}
Quantify the Reading
LDR Sensor Connection
|Reading on Graph
Line Graph
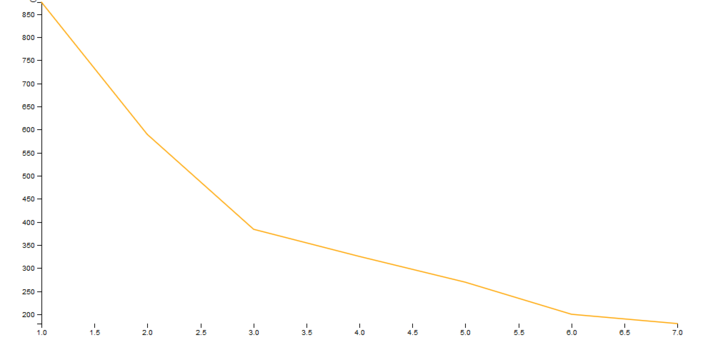
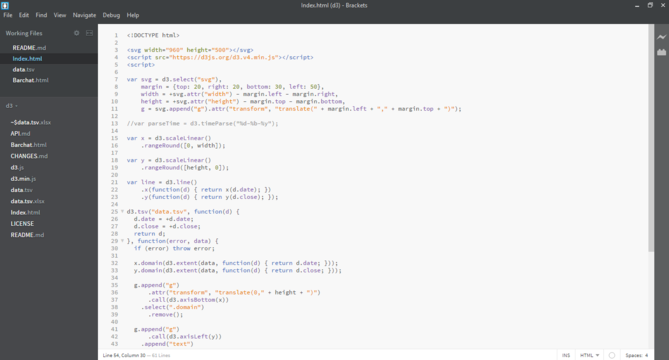
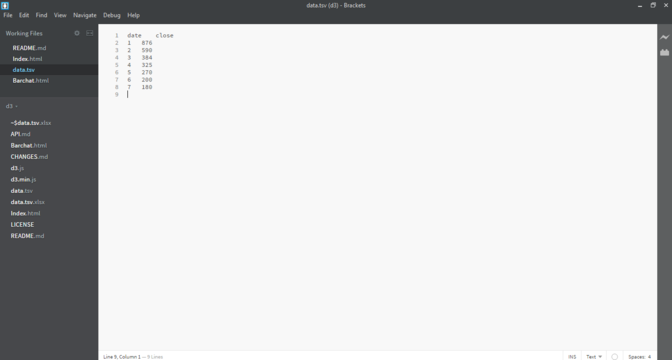
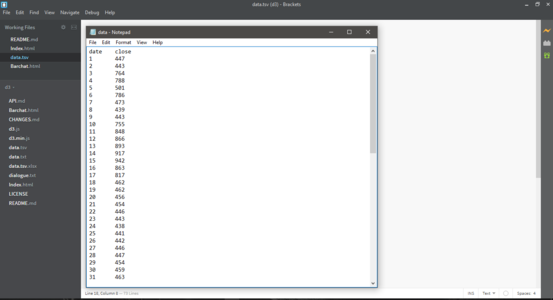
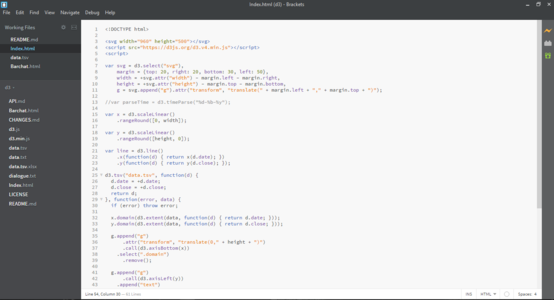
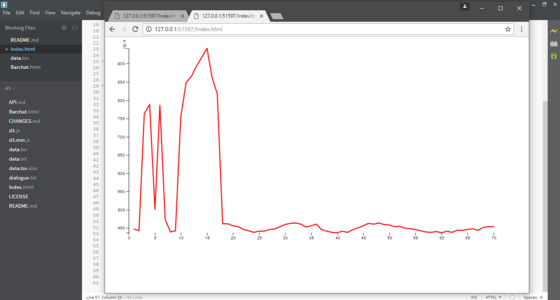
Through the help of third party app (D3) and using HTML (Brackets) I try to generate a Line Map of the Data coming through the Sensor.
Line Graph on WebPage
Using of HTML code and D3
Data Sheet
Cyborg & Posthuman
Cyborg
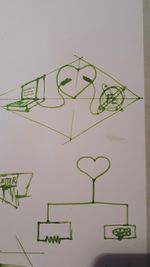
cy·borg, Cyborg is basically half human and half machine. In my perspective its more likeCyborg have a heart of the human and body of machine, which gives felling and creates a boundary between Robotrobot and Cyborg.PostHuman
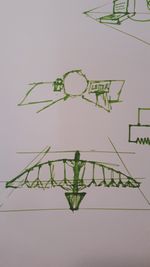
Post-human or Posthuman , are those who reached beyond the humans, now it could be in the sense of knowledge or entity or in different ways. i feel somewhere Leonardo da vinci knowledge is way more advance from the humans in that era, which according to me make him Posthuman
Future Watch
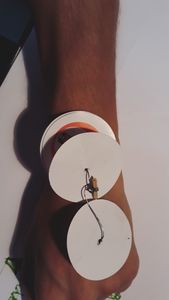
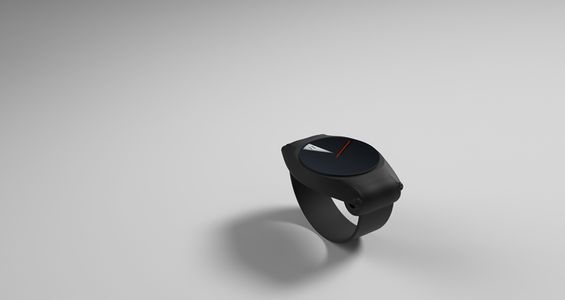
10 years from now, who should a watch look like? Skip is a watch of future. Its works basically on the Split-Screen technology, which given 3 different screens of the watch, through which a person can do multiple things like health Statics information, travelling information, security, hologramic refection, time & date, tagging of your position, GPS and a 360 degree camera.
Split A Watch
|3D Model of the Watch
Observing the city
Bangalore Air Pollution
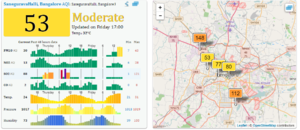
As we know how rapidly Bangalore developing, people who0 were staying nearby cities start moving toward Bangalore and because of that population of Bangalore increased drastically. Everyone wants to develop, according to a report more than +60lakh of vehicles registered on the road of Bangalore and thus increasing the Temperature and Air Pollution of the city. A report confirms that more than 280 ppm pollution reading in air is drastic for human health[4]. But we still don’t care, here[5] is a live map which record and tell how much air pollution is in Bangalore right now.
Mapping
A group of people keep eyes on the major part of the city and record the Air pollution and the particles in the air, so that everyone can aware what they inhaling in those areas and what precaution they can take it[6] [7].
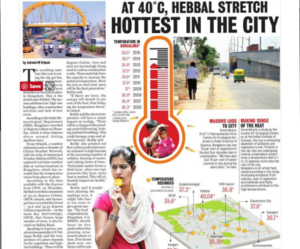
The rapid increasing of air pollution, start changing the climate of the city. The report shows that every year +5 degree Celsius increasing.
Data Visualisation
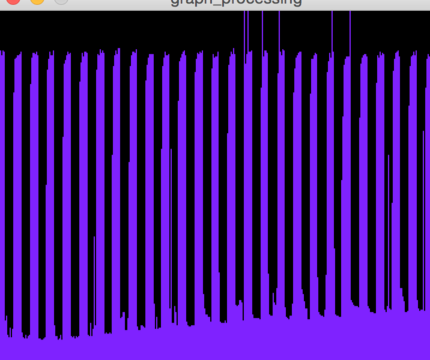
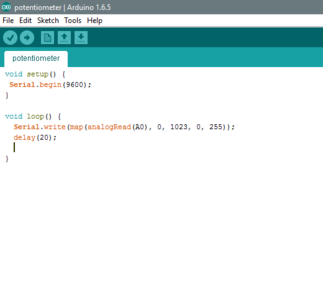
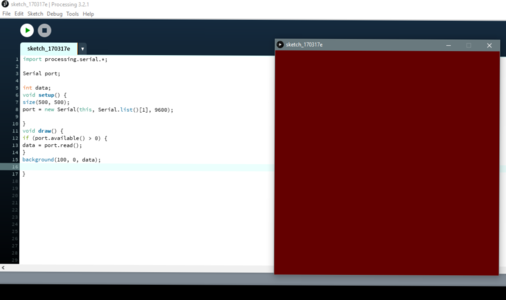
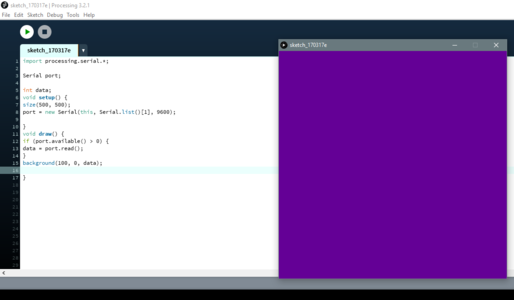
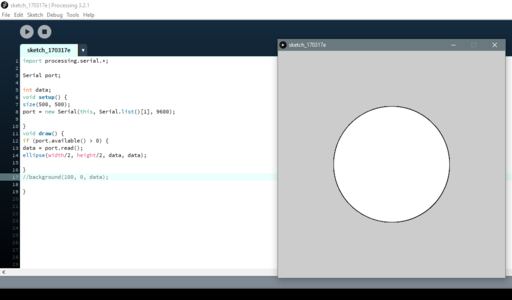
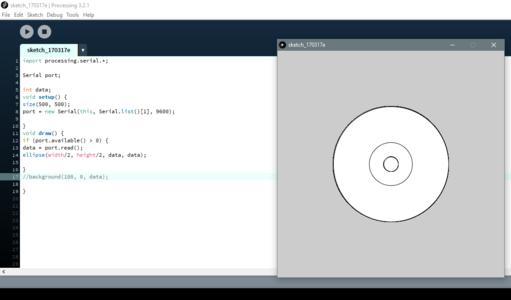
Mapping a given data in visual representation is enhancing its appeal to its audience, but mapping a live streaming data is kind of tough but very helpful. If you ever seen a heartbeat monitoring system its map a live data coming from the patient. I also tried to represent a data through visuals by the help of Arduino and Processing. I wrote a code for potentiometer and send to Arduino and through the help of processing I record the data representation by changing the voltage going inside the potentiometer.
Code for Potentiometer
Data Visualization on Processing
Data Visualization on Processing
Data Visualization on Processing
Data Visualization on Processing
LOGGING LIVE DATA
ARDUINO DATA
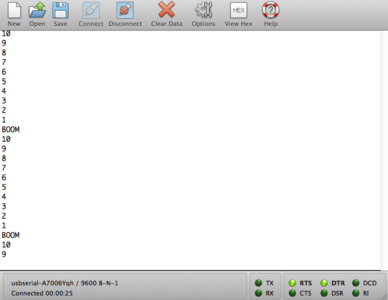
Often, we lose the data which coming from the Arduino and cant able to use in future. To solve this problem I used a third party app, which saves the data coming from the serial monitor in Excel Sheet directly. Now, I have the data which I can use in future.
