Difference between revisions of "Sushil Sylvester"
(Created page with " = Introduction = ==Sensors == Sensors are devices that we use to record or measure the physical properties around us like the temperature, sound, light, etc. The sensors whic...") |
(→EMF SENSOR) |
||
| (22 intermediate revisions by one user not shown) | |||
| Line 9: | Line 9: | ||
The equation used to find the resistances of the resistors is 1/Rt = 1/R1 + 1/R2 + 1/R3….+1/Rn where R is the resistance of the resistors. | The equation used to find the resistances of the resistors is 1/Rt = 1/R1 + 1/R2 + 1/R3….+1/Rn where R is the resistance of the resistors. | ||
| − | |||
[[File:Resistors in parallel.jpg |thumb|center|]] | [[File:Resistors in parallel.jpg |thumb|center|]] | ||
| Line 18: | Line 17: | ||
[[File:Resistors in series.jpg |thumb|center|]] | [[File:Resistors in series.jpg |thumb|center|]] | ||
| + | |||
| + | ==Capacitors== | ||
| + | ===Capacitors in parallel=== | ||
| + | When capacitors are connected in parallel their total capacitance increases. When the capacitors are connected in parallel the total surface area of the plates in the capacitors increases hence raising the capacitance. | ||
| + | [[File:Capacitors in parallel .jpg |thumb|center|]] | ||
| + | |||
| + | ===Capacitors in series=== | ||
| + | When capacitors are connected in parallel their total capacitance decreases. When the capacitors are connected in series the total distance between the plates in the capacitors increases hence the total capacitance decreases. | ||
| + | [[File:Capacitors in series.jpg |thumb|center|]] | ||
| + | |||
| + | |||
| + | |||
| + | = Sensors = | ||
| + | ==Sound Sensor== | ||
| + | The sound sensor is like a microphone that you can connect to the Arduino to sense sound. It is a fairly basic sensor with three pins vcc, ground and output. It has a knob on it which is use to calibrate its sensitivity. While using the sound sensor I learnt how to use the map function in the Arduino code. The map function condenses large values into smaller values to make it easier for the user to understand and also it is easier to time your output from the Arduino. I connected a servo motor and a led to the Arduino, so whenever a loud noise was made the servo motor would turn 90 degrees and the led would light up. | ||
| + | <gallery mode="packed-hover" heights="300"> | ||
| + | File:SoundSensorWithServoAndLed1.jpg|Sound Sensor circuit|500px| | ||
| + | File:SoundSensorCode.jpg|Sound Sensor code|500px| | ||
| + | File:SoundSensor.jpg|Sound Sensor|500px| | ||
| + | File:SoundSensorWithServoAndLed.jpg|Sound Sensor circuit|500px| | ||
| + | </gallery> | ||
| + | |||
| + | =Turbidity Sensor= | ||
| + | Turbidity is the measurement of how opaque a liquid is. Turbidity depends on the dirt and other foreign particles in the liquid. We had to make a turbidity sensor in class using a LDR and a light source. Our teams main struggle was to figure out the best way to display the results that the LDR was reading. We decided to use a small 16X2 LCD display to display the brightness readings. | ||
| + | |||
| + | |||
| + | <gallery mode="packed-hover" heights="300" > | ||
| + | File:TurbiditySensorCricuit.jpg| | ||
| + | File:TurbiditySensorCode.jpg|thumb| | ||
| + | File:TurbiditySensorLCDdisplay.jpg| | ||
| + | File:ElectronicsInTheBox.JPG| | ||
| + | File:TurbiditySensor2.jpg | ||
| + | File:LDRandlightsource.JPG| | ||
| + | File:TurbiditySensorTesting.jpg| | ||
| + | File:TurbiditySensorReadings.JPG| | ||
| + | File:TurbiditySensorTestGraph.jpg| | ||
| + | </gallery> | ||
| + | |||
| + | =Maps of Bangalore= | ||
| + | <gallery mode="packed-hover" heights="300"> | ||
| + | File:Land use changes in greater bangalore.jpg | This map of Bangalore shows the changes in the population and the land use by the growing inhabitants of Bangalore over time. | | ||
| + | |||
| + | File:Population distribution and growth in bangalore.jpg| Map of Bangalore showing the growth and distribution of the population over time. | | ||
| + | |||
| + | File:Elevation of Bangalore .jpg|This map of Bangalore shows the different levels of elevation in the landscape of Bangalore.| | ||
| + | |||
| + | File:Distribution of vegetation in Bangalore.jpg|This map of Bangalore shows the distribution of vegetation in Bangalore.| | ||
| + | </gallery> | ||
| + | |||
| + | =EMF SENSOR= | ||
| + | We had to make a EMF detector in class using the Arduino uno. After researching on the internet we realised that the EMF detector requires only a wire that is connected to the input pin of the Arduino. Using the EMF readings we connected LED's to blink according to the EMF readings. | ||
| + | <gallery mode="packed-hover" heights="400"> | ||
| + | File:EMF detector.jpg| | ||
| + | File:Code for the emf detector.jpg| | ||
| + | File:Code for emf detector 2.jpg| | ||
| + | </gallery> | ||
| + | |||
| + | =CO2 Sensor= | ||
| + | For my final project I made a carbon dioxide sensor using lime water and a turbidity sensor. The lime water in the container reacts with the CO2 in the atmosphere and becomes turbid. The turbidity of the lime water depends on the amount of CO2 that passes through it. Ive used a air pump to pump air into the lime water for exactly 60 seconds. To control the air pump using the Arduino a motor shield was required as the power supplied by the arduino wasn't sufficient to power the air pump. The turbidity sensor uses a LDR to sense the amount of light passing through the lime water solution. I used a LCD display to show the readings of the LDR in real time. | ||
| + | <gallery mode="packed-hover" heights="300"> | ||
| + | File:CO2 sensor -01.png| | ||
| + | File:CO2 sensor -02.jpg| | ||
| + | File:CO2 sensor -03.jpg| | ||
| + | File:CO2 sensor assembly.jpg| | ||
| + | File:Air pump.jpg| | ||
| + | File:Code for the CO2 sensor.jpg| | ||
| + | File:CO2 sensor final.jpg| | ||
| + | </gallery> | ||
| + | [[File:CO2 sensor final disply.jpg|center|1180px]] | ||
Latest revision as of 09:06, 11 April 2017
Contents
Introduction
Sensors
Sensors are devices that we use to record or measure the physical properties around us like the temperature, sound, light, etc. The sensors which indicate this data can also be used to respond to particular conditions in the environment like the temperature sensor can be used to sound an alarm when the temperature is too low.
Resistors
Resistors in parallel
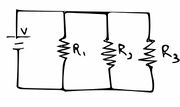
Any number of Resistors that are connected to a power source individually are said to be resistors connected in parallel. When resistors are connected in parallel the voltage that the battery produces is the same across each component of the parallel circuit. The total current passing through each path is equal to the total current flow from the source. Resistors in parallel have a common voltage across them. This connection is used when you want to reduce the total resistance in the circuit.
The equation used to find the resistances of the resistors is 1/Rt = 1/R1 + 1/R2 + 1/R3….+1/Rn where R is the resistance of the resistors.
Resistors in series
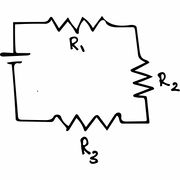
Resistors are said to be connected in series when one leg of the resistor is connected to one terminal of the battery and the other leg is connected to another resistor until the circuit is completed when the second leg of the last resistor is connected to the other terminal of the battery. Resistors in series have a common current flowing through them as the current that flows through one resistor must also flow through the others as it can only take that path. This connection is used to increase the total resistance of the circuit.
The equation used to find the resistances of the resistors is Rt = R1 + R2 + R3…+Rn where R is the resistors used in the circuit.
Capacitors
Capacitors in parallel
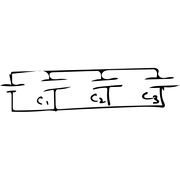
When capacitors are connected in parallel their total capacitance increases. When the capacitors are connected in parallel the total surface area of the plates in the capacitors increases hence raising the capacitance.
Capacitors in series
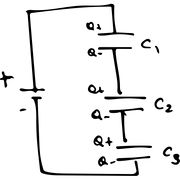
When capacitors are connected in parallel their total capacitance decreases. When the capacitors are connected in series the total distance between the plates in the capacitors increases hence the total capacitance decreases.
Sensors
Sound Sensor
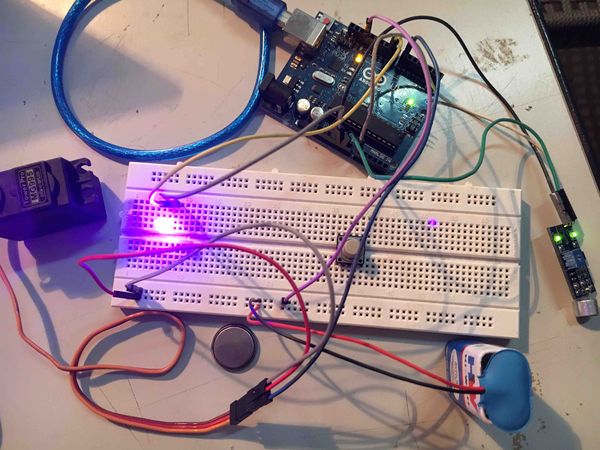
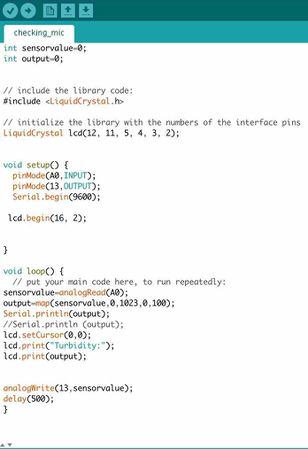
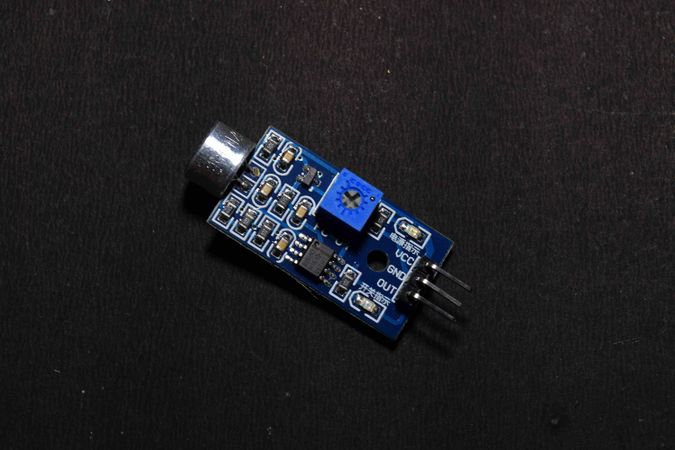
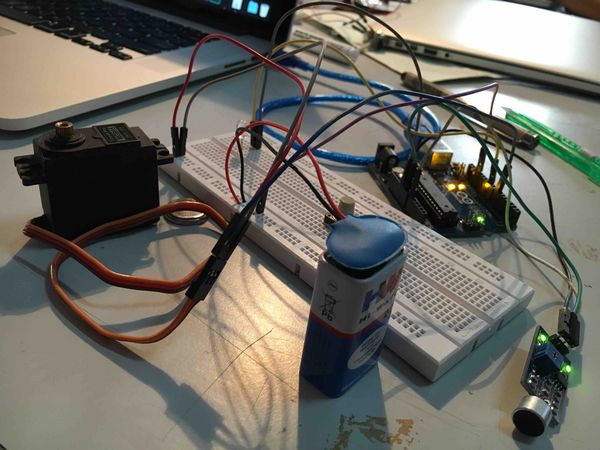
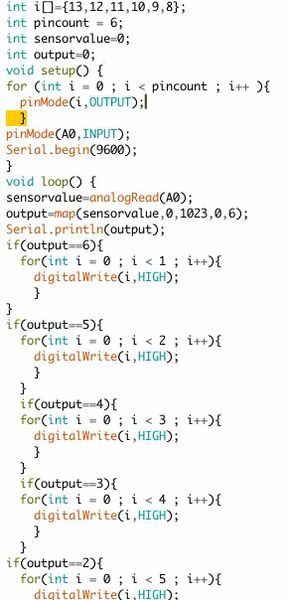
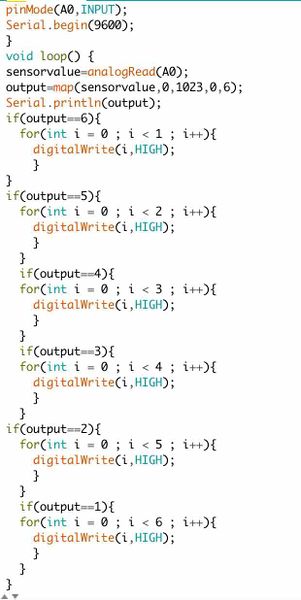
The sound sensor is like a microphone that you can connect to the Arduino to sense sound. It is a fairly basic sensor with three pins vcc, ground and output. It has a knob on it which is use to calibrate its sensitivity. While using the sound sensor I learnt how to use the map function in the Arduino code. The map function condenses large values into smaller values to make it easier for the user to understand and also it is easier to time your output from the Arduino. I connected a servo motor and a led to the Arduino, so whenever a loud noise was made the servo motor would turn 90 degrees and the led would light up.
Sound Sensor circuit|500px|
Sound Sensor code|500px|
Sound Sensor|500px|
Sound Sensor circuit|500px|
Turbidity Sensor
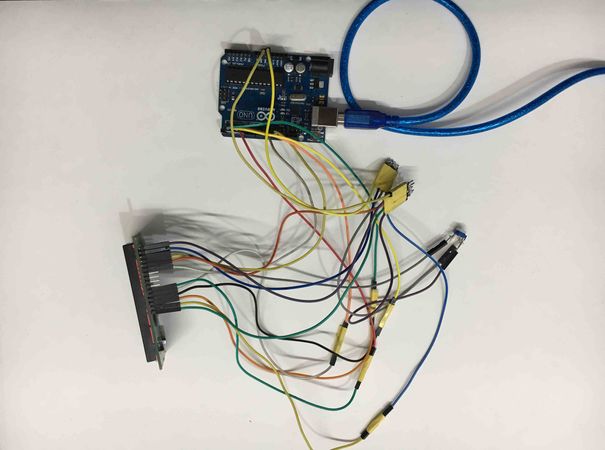
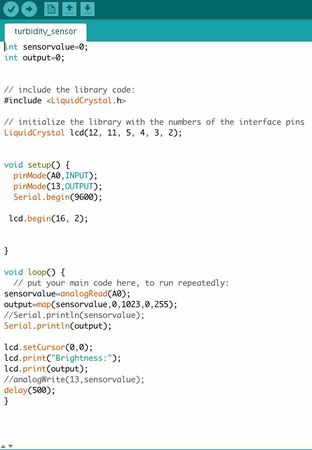
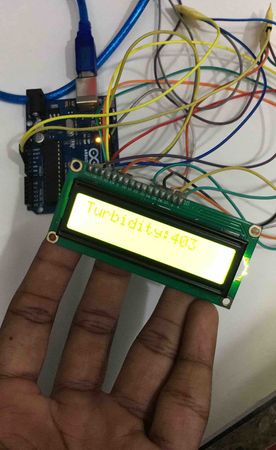
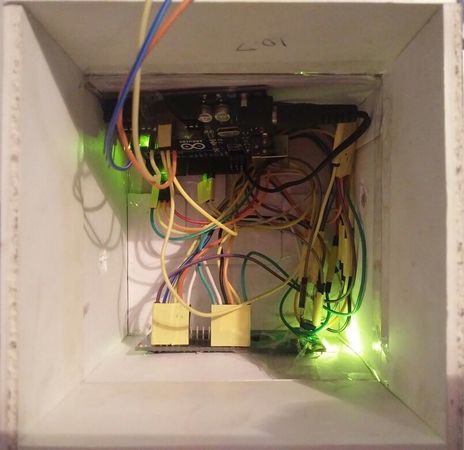
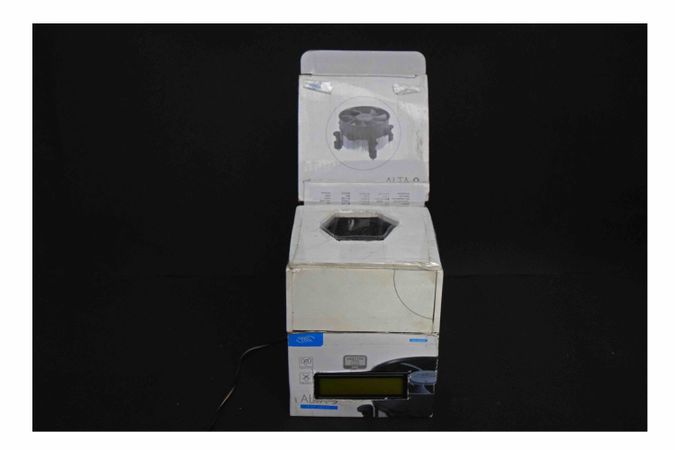
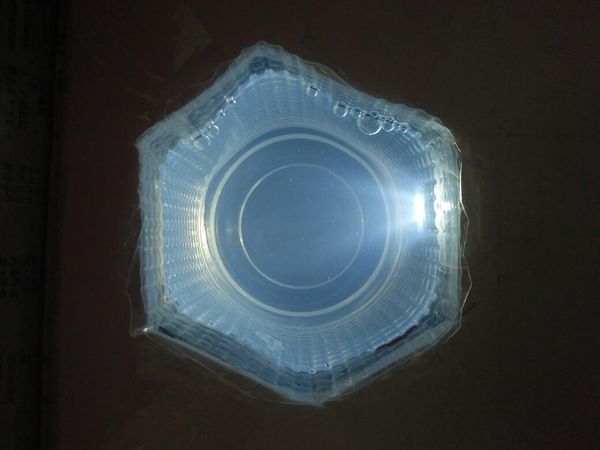
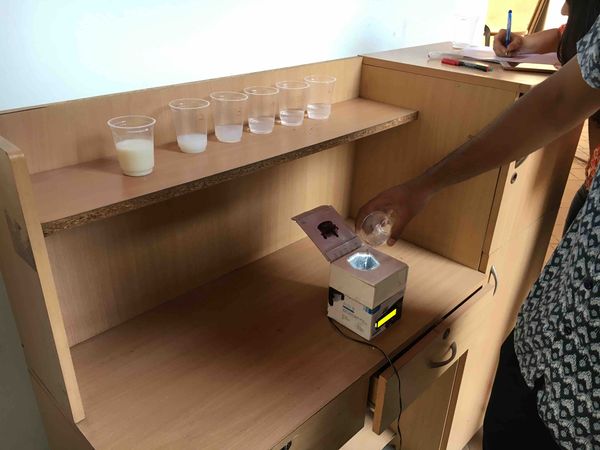
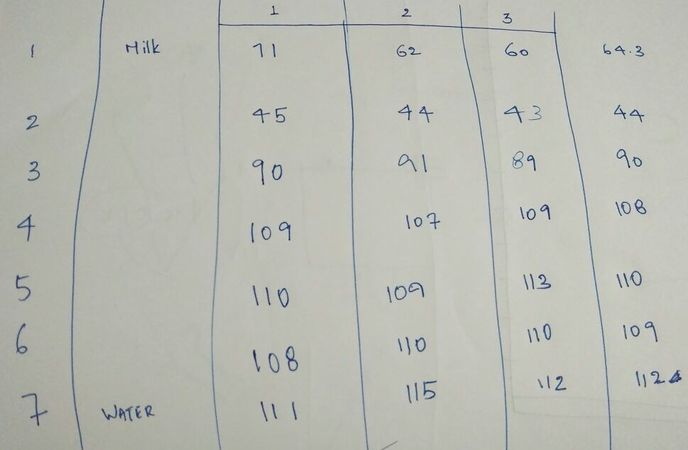
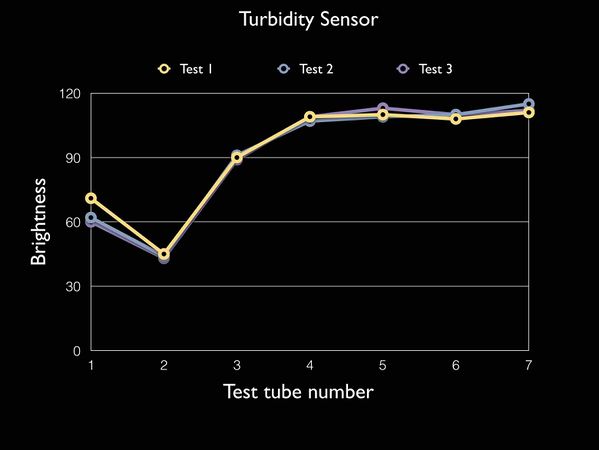
Turbidity is the measurement of how opaque a liquid is. Turbidity depends on the dirt and other foreign particles in the liquid. We had to make a turbidity sensor in class using a LDR and a light source. Our teams main struggle was to figure out the best way to display the results that the LDR was reading. We decided to use a small 16X2 LCD display to display the brightness readings.
thumb|
Maps of Bangalore
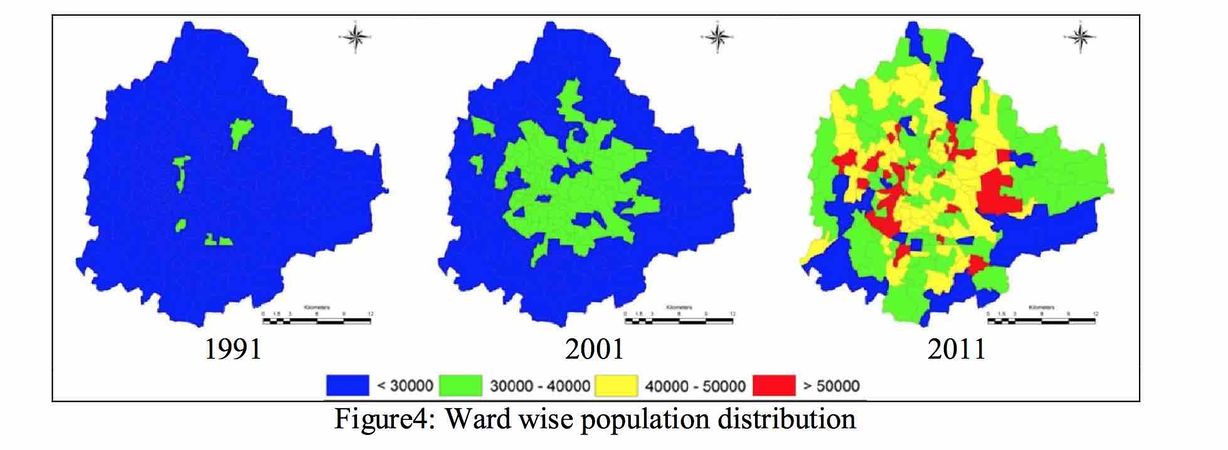
This map of Bangalore shows the changes in the population and the land use by the growing inhabitants of Bangalore over time. |
Map of Bangalore showing the growth and distribution of the population over time. |
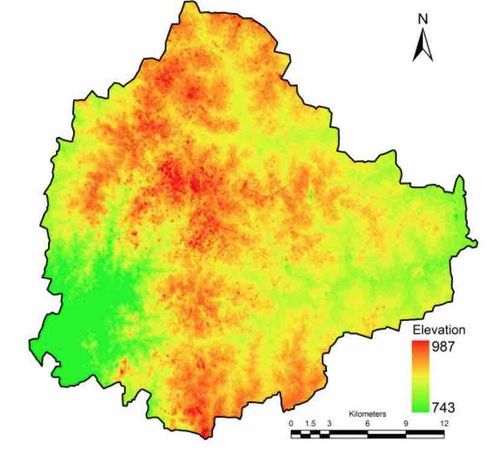
This map of Bangalore shows the different levels of elevation in the landscape of Bangalore.|
This map of Bangalore shows the distribution of vegetation in Bangalore.|
EMF SENSOR
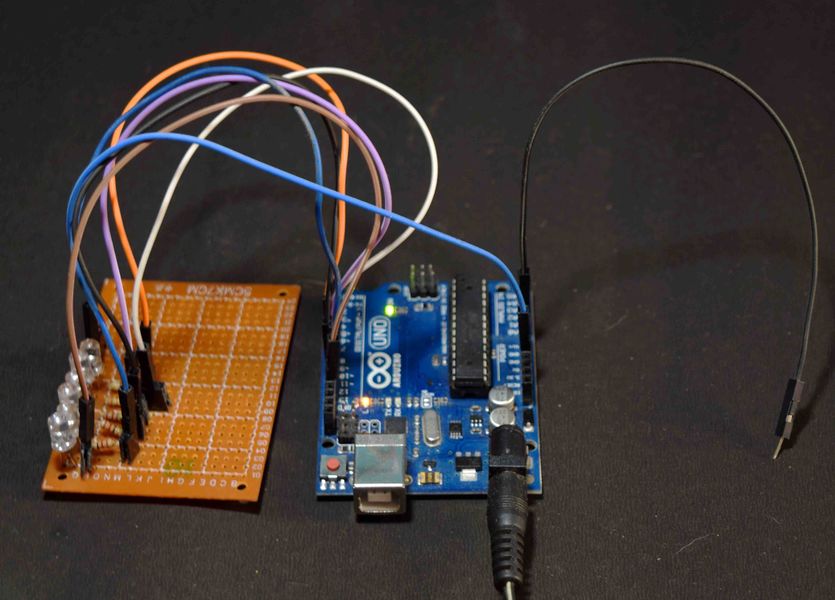
We had to make a EMF detector in class using the Arduino uno. After researching on the internet we realised that the EMF detector requires only a wire that is connected to the input pin of the Arduino. Using the EMF readings we connected LED's to blink according to the EMF readings.
CO2 Sensor
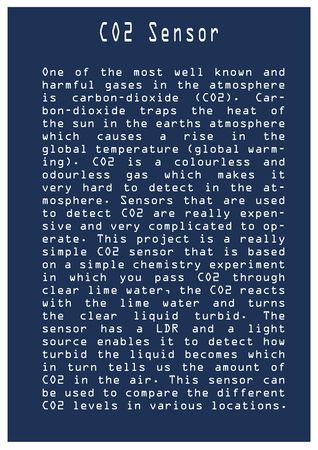
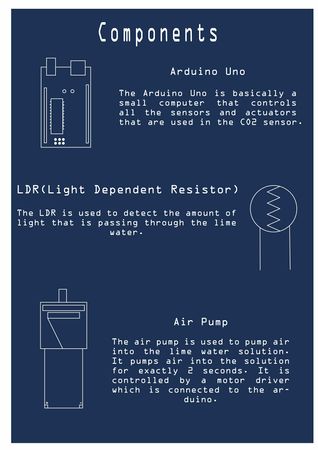
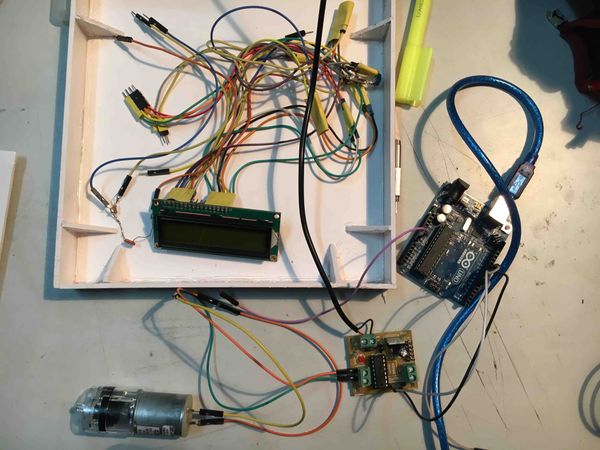
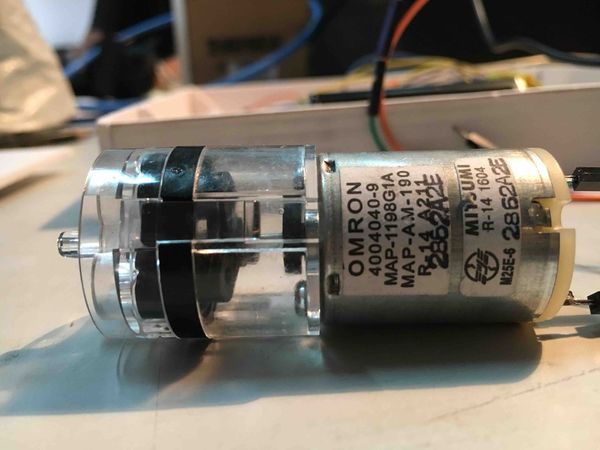
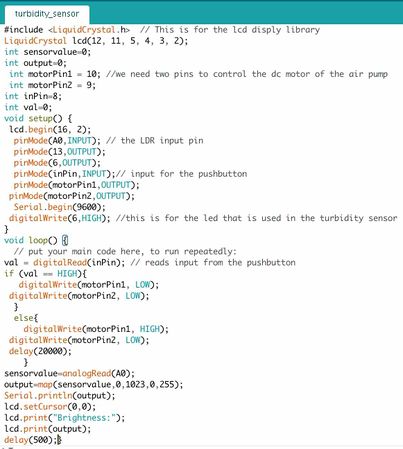
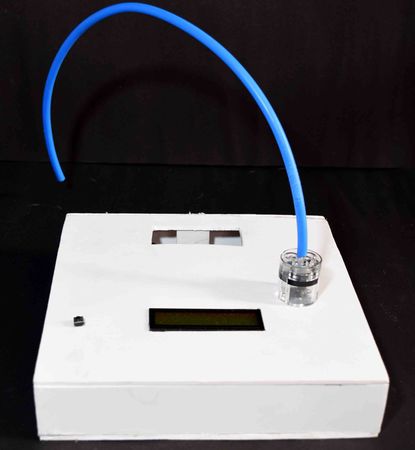
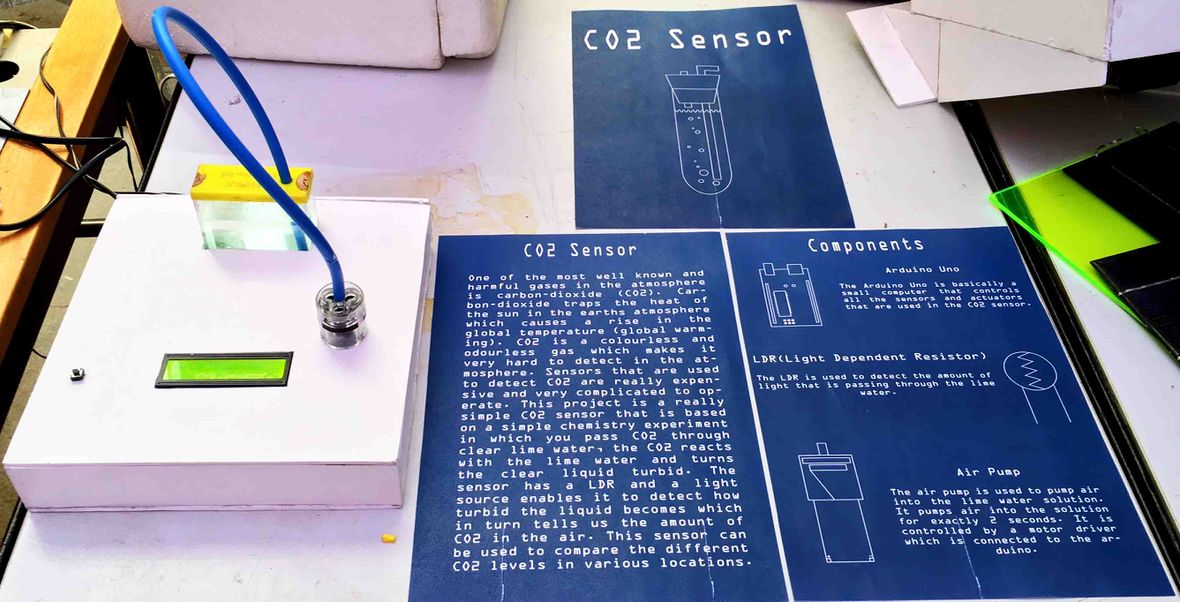
For my final project I made a carbon dioxide sensor using lime water and a turbidity sensor. The lime water in the container reacts with the CO2 in the atmosphere and becomes turbid. The turbidity of the lime water depends on the amount of CO2 that passes through it. Ive used a air pump to pump air into the lime water for exactly 60 seconds. To control the air pump using the Arduino a motor shield was required as the power supplied by the arduino wasn't sufficient to power the air pump. The turbidity sensor uses a LDR to sense the amount of light passing through the lime water solution. I used a LCD display to show the readings of the LDR in real time.
