DIY pollution sensor
Real world problems: Sensing air pollution
When given this project we had no clue how to go about it. For this, we looked at the existing websites like Air Casting, Meta map(Jugaad sensor), Data canvas. From which we figured out three streams of enquiry for us:
What will we sense? What kind of pollution?
How would it be transmitted to a database?
How would we convey it to people? Infographics and programming bit of it.
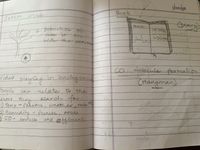
We started with listing down the points what we could think of. Initially we weren’t sure about which pollution to work upon. In groups, we began with research and brainstorming on ideas and different things we could work on. After researching we decided to work on air pollution. Staring with air pollution we ideated about how and what we needed to have within the sensor. From our research we figured out that there are three major air pollutants namely; carbon monoxide, nitrogen dioxide and sulphur dioxide. However, after looking at all possibilities, like availability of sensors , cost, feasiblity in given time etc. we decided to go for these three components; carbon monoxide, humidity and temperature.
We grouped ourselves within, and in groups we distributed work. One group worked on the circuit, and the device appearance. Another group worked on the tranmission of data from the values that we get into either a website or an app. Yet another group worked on the infographics bit, for conveying the data to the people in an understandable manner. We decided to go for website as it was appropriate for the given time period.
Building the circuit
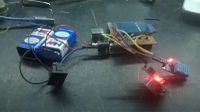
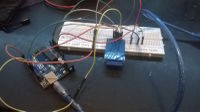
We looked for circuits online, tried if they were working. Initially we faced problems as the sensors were working individually in the circuit. Later there was a task to make both the sensors work together. However, the readings that we got through the Arduino were the output voltage of the sensors. It was a task to convert these readings to the unit measures. As we weren’t able to find sufficient programming information from the internet that would help us with this conversion, it was a big trial and error quest. We managed to do that and soldered it to the PCB. Now the readings we got were in ppm (Carbon monoxide), % (Humidity) and ℃ (Temperature).
Transmitting the data
There were a couple of possible methods in which we could transmit the data from the Arduino to a laptop or phone. These included wifi shield, bluetooth shield, SD card shield, GSM shield etc. We decided to experiment with SD card shield and bluetooth shield. SD card shield was comparitively easy to work with as we were able to figure out the Arduino programming. Bluetooth and the wifi shield required some extra components for it to work along with the circuit. As the components required were not easily available we decided to carry forward with the method of tranmitting data using an SD card shield.
Representing the data (Infographics)
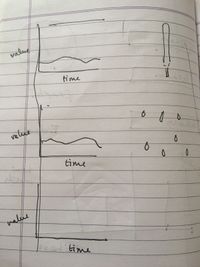
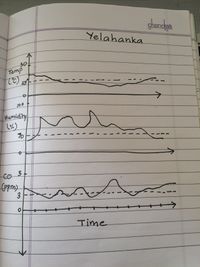
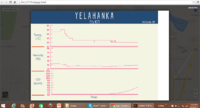
We looked upon internet for various different types of maps and ways of representing the data. Out of which we realised that a graph would be able to convey it most effectively to the audience. Also, graph was a feasible option as per the given time and the programming required to do the same. We brainstormed around a couple of variations and finalised one which used a line graph.
The location would be placed as a header (center aligned) along with date and time. The x-axis would represent the time whereas the y-axis would consist of the unit. The final graphs were made on illustrator.
Programming for the website
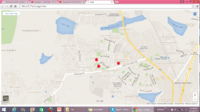
This was a challenging task as none of us had worked with html programming before. We planned to include Raphael.js for graphing out the data. However, as we started with actual programming, we realized we weren’t able to include everything into it. If we had already known html programming, we could have represented the data in a much better way. We decided on placing a map of Yelahanka on a page, which would have dots as links in different areas. As you click on them, another link opens; which shows the graph of the readings of that place.
We took a jpg map of Bangalore, created a red dot and used a lightbox trigger. JavaScript library was used to open the image of the graph of the collected data. It helps in opening the image on an existing image than opening it into a new image. We programmed it in such a way that once you click outside the graph, it goes back the the map. We even leant the different functions like absolute, relative and fixed auto etc. and also position, z-index, width, height, div, para and so on. We then tried including JavaScript library into html file, plotting multiple points and multiple graphs but it didn’t work out. Hence, we, for the time being decided on encripting a jpeg graph made on illustrator. Later we were also able to embed an actual Google map to the webpage instead of a mere jpeg one. Multiple data was taken from different areas in Yelahanka New Town and were placed accordingly on the webpage.
Final device
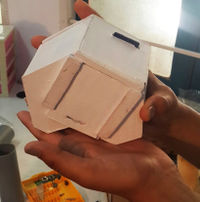
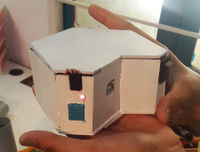
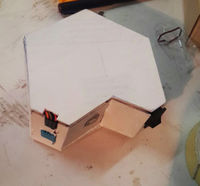
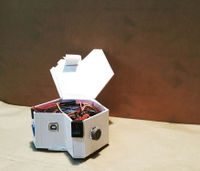
We started with ideating about the shape we wanted to have. We though of keeping it simple yet attractive. The box had to be designed in such a way that the circuits fits in properly causing no damage to the connections. Also, with this we didn’t want it to be a square. Keeping in mind we came up with a geometrical shape which had cavities for the sensors and was compact as well. Starting with the process of making we took measurements of the circuit and made the base. Kept a buffer height so that there was no damage to the connections. Later, took measurements of the sensors and made cavities for them and the switch. Next part was to design the battery space so that it becomes easy to replace them. To make this easy , we made a opening at the bottom and gave it a sliding cover . Material used to make this was a thin sun board, which was easy to work with and overall gave a better apperance to the device. Later, we gave it a coat of white acrylic paint which gave it a finished look.
Arduino program
include <SD.h> include <dht.h>
define dht_dpin A1 //no ; here. Set equal to channel sensor is on
dht DHT;
// GAS SENSOR MQ-2
// This sensor can detect smoke, methane, carbon dioxide and other gases
//VARIABLES
float Ro = 10000.0; // this has to be tuned 10K Ohm
int sensorPin = 0; // select the input pin for the sensor
int ledPin = 13; // select the pin for the LED
int val = 0; // variable to store the value coming from the sensor
float Vrl = 0.0;
float Rs = 0.0;
float ratio = 0.0;
const int chipSelect = 4;
// SETUP void setup() {
 pinMode(ledPin, OUTPUT); // declare the ledPin as an OUTPUT
 Serial.begin(9600);      // initialize serial communication with computer
 Serial.begin(9600);
 while (!Serial) {
   ; // wait for serial port to connect. Needed for Leonardo only
 }
 Serial.print("Initializing SD card...");
 // make sure that the default chip select pin is set to
 // output, even if you don't use it:
 pinMode(10, OUTPUT);
 // see if the card is present and can be initialized:
 if (!SD.begin(chipSelect)) {
   Serial.println("Card failed, or not present");
   // don't do anything more:
   return;
 }
 Serial.println("card initialized.");
  Serial.begin(9600);

 delay(300);//Let system settle

 Serial.println("Humidity and temperature\n\n");

 delay(700);//Wait rest of 1000ms recommended delay before

 //accessing sensor
//end "setup()"
}
// analogReference(EXTERNAL);
// get CO ppm
float get_CO (float ratio) {
 float ppm = 0.0;
 ppm = 37143 * pow (ratio, -3.178);
 return ppm;
}
// LOOP void loop() {
DHT.read11(dht_dpin);
 val = analogRead(sensorPin);     // read the value from the analog sensor
 Serial.println(val);             // send it to the computer (as ASCII digits)
 digitalWrite(ledPin, HIGH);      // turn the ledPin on
 delay(100);                      // stop the program for some time
 digitalWrite(ledPin, LOW);       // turn the ledPin off
 delay(100);                      // stop the program for some time
 Vrl = val * ( 5.00 / 1024.0  );      // V
 Rs = 20000 * ( 5.00 - Vrl) / Vrl ;   // Ohm
 ratio =  Rs / Ro;
 delay(10000);
 Serial.print ( "Vrl / Rs / ratio:");
 Serial.print (Vrl);
 Serial.print(" ");
 Serial.print (Rs);
 Serial.print(" ");
 Serial.println(ratio);
 Serial.print ( "CO ppm :");
 Serial.println(get_CO(ratio));
   Serial.print("Current humidity = ");

   Serial.print(DHT.humidity);

   Serial.print("%  ");

   Serial.print("temperature = ");

   Serial.print(DHT.temperature);

   Serial.println("C  ");

 delay(2000);//Don't try to access too frequently... in theory
 float ppm = get_CO(ratio);
 int tmp = DHT.temperature;
 int hud = DHT.humidity;

 String dataString = "";
 dataString += String(ppm);
 dataString += "     ";
  dataString += String(tmp);
  dataString += "     ";
   dataString += String(hud);
 // so you have to close this one before opening another.
 File dataFile = SD.open("datalog.txt", FILE_WRITE);
 // if the file is available, write to it:
 if (dataFile) {
   dataFile.println(dataString);
   dataFile.close();
   // print to the serial port too:
   Serial.println(dataString);
 }
 // if the file isn't open, pop up an error:
 else {
   Serial.println("error opening datalog.txt");

   {
 delay(10000);


   }
 }
}
HTML code
<!doctype html>
<html>
<head>
<meta charset="utf-8">
<title>page</title>
<style media="all">
.marker {position:absolute;}
- wrapper {
}
- lightbox {
}
- lightbox p {
}
- lightbox img {
}
</style>
</head>
<body>
class="lightbox_trigger" target="_blank"><img src="images/dot3.png" width="20" height="24" alt=""/>
</a>
target="_blank"><img src="images/dot3.png" width="20" height="24" alt=""/>
</a>
class="lightbox_trigger" target="_blank"><img src="images/dot3.png" width="20" height="24" alt=""/>
</a>
<map name="Map">
</map>
<map name="Map">
</map>
<script src="http://code.jquery.com/jquery-1.6.2.min.js"></script>
<script>
jQuery(document).ready(function($) {
$('.lightbox_trigger').click(function(e) {
//prevent default action (hyperlink)
e.preventDefault();
//Get clicked link href
var image_href = $(this).attr("href");
/*
If the lightbox window HTML already exists in document,
change the img src to to match the href of whatever link was clicked
If the lightbox window HTML doesn't exists, create it and insert it.
(This will only happen the first time around)
- /
if ($('#lightbox').length > 0) { // #lightbox exists
}
else { //#lightbox does not exist - create and insert (runs 1st time only)
}
});
//Click anywhere on the page to get rid of lightbox window
$('#lightbox').live('click', function() { //must use live, as the lightbox element is inserted into the
DOM
$('#lightbox').hide();
});
});
</script>
</body>
</html>
