Difference between revisions of "Rhea Banthia"
Rhea banthia (Talk | contribs) (→PROJECTS) |
Rhea banthia (Talk | contribs) (→Smart Light (Final Project)) |
||
| (49 intermediate revisions by one user not shown) | |||
| Line 21: | Line 21: | ||
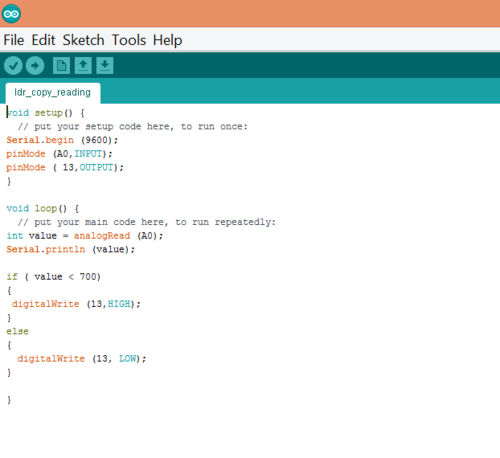
An LDR or light dependent resistor is also known as photo resistor, photocell, photoconductor.It is a one type of resistor whose resistance varies depending on the amount of light falling on its surface. When the light falls on the resistor, then the resistance changes. These resistors are often used in many circuits where it is required to sense the presence of light. These resistors have a variety of functions and resistance. For instance, when the LDR is in darkness, then it can be used to turn ON a light or to turn OFF a light when it is in the light. | An LDR or light dependent resistor is also known as photo resistor, photocell, photoconductor.It is a one type of resistor whose resistance varies depending on the amount of light falling on its surface. When the light falls on the resistor, then the resistance changes. These resistors are often used in many circuits where it is required to sense the presence of light. These resistors have a variety of functions and resistance. For instance, when the LDR is in darkness, then it can be used to turn ON a light or to turn OFF a light when it is in the light. | ||
| + | |||
| + | |||
| + | |||
| + | |||
| + | |||
| + | |||
=== Potentiometer === | === Potentiometer === | ||
| − | |||
| − | + | [[File:Potentiometer image.png|thumb]] | |
| + | |||
| + | A potentiometer, informally a pot, is a three-terminal resistor with a sliding or rotating contact that forms an adjustable voltage divider. | ||
| + | |||
| + | |||
| + | |||
| + | |||
| + | |||
| − | |||
| − | == | + | ==Circuit== |
=== Resistance === | === Resistance === | ||
| Line 57: | Line 68: | ||
As seen in the example above, the total resistance in series is more as compared to total resistance in parallel which is why the current flowing through series is lesser that the current flowing through parallel. Therefore, a series resistance is created to increase resistance in a circuit and parallel to decrease resistance. | As seen in the example above, the total resistance in series is more as compared to total resistance in parallel which is why the current flowing through series is lesser that the current flowing through parallel. Therefore, a series resistance is created to increase resistance in a circuit and parallel to decrease resistance. | ||
| − | |||
| − | |||
| − | |||
| − | |||
= CIRCUITS AND CODING = | = CIRCUITS AND CODING = | ||
| Line 84: | Line 91: | ||
[[File:Led + potentio.jpg]] | [[File:Led + potentio.jpg]] | ||
| − | |||
| − | |||
== How to use an IR sensor? == | == How to use an IR sensor? == | ||
| Line 108: | Line 113: | ||
== Spinning cup == | == Spinning cup == | ||
| + | |||
| + | |||
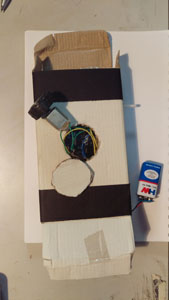
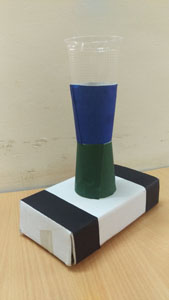
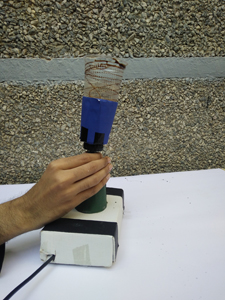
| + | Not knowing much about coding and circuits yet, I helped the team making the spinning cup with the structure. The basic circuit included a motor that the glass was stuck on, a potentiometer that changed the speed of rotation and an Arduino that gave these two sensors some information to function the way they did. | ||
| + | |||
| + | |||
| + | Process images | ||
| + | |||
| + | [[File:Cupos.jpg]] [[File:Outer.jpg]] [[File:Last.jpg]] | ||
| + | |||
| + | |||
| + | The spinning cup | ||
| + | |||
| + | [[File:Spinning cup.jpg]] | ||
| + | |||
| + | |||
| + | {{#ev:youtube|8LihAEqWh4A}} | ||
== Field visit == | == Field visit == | ||
| Line 170: | Line 191: | ||
=== Line chart for Turbidity meter === | === Line chart for Turbidity meter === | ||
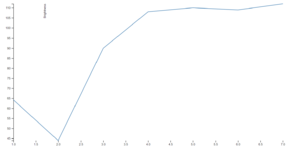
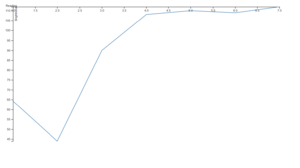
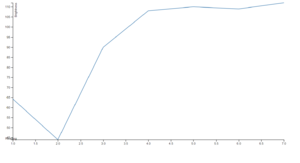
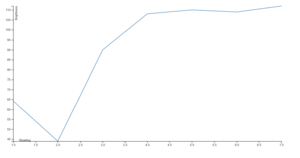
| + | After studying the line chart on D3, a JavaScript library for producing dynamic, interactive data visualizations in web browsers, we made a line chart for the turbidity meter built earlier. For this, we saved the same code and data for the line chart on D3 and modified it. We had to download a text editor that doesn’t change the format of the file when saved. I faced problem using “Sublime” since it didn’t work for windows. I then downloaded “Brackets”, copied the code and went ahead with modifying it. The code being in java script, I faced problems understanding it. But when I started decoding and experimenting with it, it became easy. I modified one thing at a time and saw what changes that modification made in the graph. This was a complete trial and error process for me. Slowly, I got the hang of it and started enjoying the process. | ||
| + | |||
| + | |||
| + | [[File:Line chart d3.PNG|400px|Line chart from D3]] | ||
| + | |||
| + | Attempts | ||
| + | |||
| + | |||
| + | [[File:Attemp_1.PNG|border|300px|y-axis changed]] [[File:Attempt 2.PNG|border|300px|'Price' on y-axis changes to 'Brightness']] [[File:Attempt 3.PNG|border|300px|var x change to Scale Linear to achieve graph]] | ||
| + | |||
| + | |||
| + | [[File:Attempt 4.PNG|border|300px]] [[File:Attempt 5.PNG|border|300px]] [[File:Attempt 6.PNG|border|300px]] | ||
| + | |||
| + | |||
| + | [[File:Attempt 7.PNG|border|300px]] [[File:Attempt 8.PNG|border|300px]] [[File:Attempt 9.PNG|border|300px]] | ||
| + | |||
| + | |||
| + | Final | ||
| + | |||
| + | [[File:Attempt 10.PNG|border|700px|Final line graph for turbidirty]] | ||
| + | |||
| + | |||
| + | [[File:Code for turbidity.PNG|600px|code for graph]] | ||
| + | |||
| + | |||
| + | [[File:Data.PNG|400px|average data recorded]] | ||
== Extension to human body in future == | == Extension to human body in future == | ||
| Line 182: | Line 229: | ||
| + | [[File:IMG 20170310 145644.jpg]] | ||
| + | |||
| + | |||
| + | |||
| + | ==Languages spoken in Bangalore== | ||
| + | |||
| + | |||
| + | |||
| + | |||
| + | |||
| + | |||
| + | [[File:Lang in banagalore.jpg]] | ||
| + | |||
| + | ==Arduino and Processing== | ||
| + | |||
| + | |||
| + | We used software called “Processing” to visually depict the serial monitor’s readings. For this, we used LDR, the most basic sensor. Depending on how much light fell on the LDR, the serial monitor readings kept changing. When Arduino was linked to Processing and the same code was given to Processing in it’s language, we achieved a visual depiction for the same readings where the reading decided the height of the line. | ||
| + | |||
| + | This was an interesting exercise. Even though the way the code is written in Processing was different from how it’s written in Arduino, I could understand some parts of it and make changes to achieve different results. | ||
| + | |||
| + | |||
| + | |||
| + | [[File:Graph 1.PNG|300px]] [[File:Graph 2.PNG|300px]] | ||
| + | |||
| + | ==Blinking an LED 5 times== | ||
| + | |||
| + | The task for the day was to make the serial monitor say something or make an LED blink for a specific number of times. For this, we created the code which made the serial monitor display a defined dialogue 5 times. The code is shown in the image below. | ||
| + | |||
| + | |||
| + | [[File:Hi 5 times.PNG|600px]] | ||
| + | |||
| + | |||
| + | |||
| + | |||
| + | |||
| + | After this, we were supposed to figure out a way to make the LED blink 5 times. I made changes in the code accordingly and had the LED blink 5 times. This wasn't very difficult to achieve. I just had to replace that part of the code that makes the serial monitor display something 5 times with a code that make the LED blink 5 times instead. | ||
| + | |||
| + | [[File:Blink led 5 times.PNG|400px]] | ||
| + | |||
| + | ==Let the serial monitor ask you the question== | ||
| + | |||
| + | |||
| + | |||
| + | [[File:Serial monitor ask question.PNG|1000px]] | ||
| + | |||
| + | |||
| + | Code with detailed description for each line. | ||
| + | |||
| + | == LED blink with respect to LDR == | ||
| + | |||
| + | |||
| + | [[File:Bink when hand on LDR.PNG|500px]] | ||
| + | |||
| + | |||
| + | |||
| + | {{#ev:youtube|GV3P_fOQ7U8}} | ||
| + | |||
| + | |||
| + | == LEDs and moisture sensor== | ||
| + | |||
| + | The task was to make 5 LEDs glow depending on the reading of sensor used. I used a moisture sensor for the same. We first learnt soldering and prepared a circuit of LEDs on a perf board. Each LED had a common ground connection but a separate connection to the pins as all of them were supposed to glow separately. For this, we used an array command. | ||
| + | |||
| + | [[File:IMG20170324155401.jpg]] [[File:IMG20170324155432.jpg]] | ||
| + | |||
| + | |||
| + | |||
| + | |||
| + | The LEDs in the circuit glowed one by one depending on the amount of moisture in the plant. | ||
| + | |||
| + | [[File:IMG20170326221921.jpg|300px]] | ||
| + | |||
| + | |||
| + | |||
| + | |||
| + | Here's the code for the same. | ||
| + | |||
| + | [[File:Moisture sensor.PNG]] | ||
| + | |||
| + | |||
| + | |||
| + | |||
| + | Another code I tried while figuring out the final code | ||
| + | |||
| + | [[File:Led ON one by one.PNG]] | ||
| + | |||
| + | == Smart Light (Final Project)== | ||
| + | |||
| + | Haven't we all seen corridor lights of a building on even post sunrise? This leads to wastage of so much electricity. This project was my attempt to solve this problem. I wanted to code the lights in such a way that they turn on and turn off automatically depending on what time of the day it is. | ||
| + | For this I first did a lot of research and read a lot online to figure out how this can be done as I had no idea about it. I read about Arduino's internal clock, tried a few things as directed by different sites, but, nothing worked. I was told that the Arduino UNO does not have a real time internal clock. But, it can read time from the laptop. I used a code on processing which enabled the Arduino to read the time from my laptop and wrote a code for the Arduino for the output i.e. LED to turn on when the clock strikes 6 pm and off when it strikes 7 am. | ||
| + | |||
| + | |||
| + | [[File:POSTER .jpg|800px]] | ||
| + | |||
| + | |||
| + | Trial code to turn on and off the Led on a particular second of the minute. | ||
| + | |||
| + | [[File:Code this is sec.PNG|700px]] | ||
| + | |||
| + | |||
| + | |||
| + | Made changes in trial code from second to hour once it worked. For some reason, the exact same syntax that worked for seconds did not work for hours, hence tried different things to fix that. | ||
| + | |||
| + | [[File:Code this is hour.PNG|600px]] | ||
| + | |||
| + | |||
| + | |||
| + | After figuring out the code, I had to shift from an LED to a bulb. Since the bulb uses so much more power than what the Arduino provides, I had to use something called a relay. I read about the relay and it's connections, soldered the connections, tried all permutations and combinations, but, for some reason it just didn't work. | ||
| + | |||
| + | [[File:IMG20170407195709.jpg|300px]] | ||
| + | |||
| + | |||
| + | Used another circuit to make the bulb work | ||
| + | |||
| + | [[File:IMG20170407193013.jpg|400px]] | ||
| + | |||
| + | |||
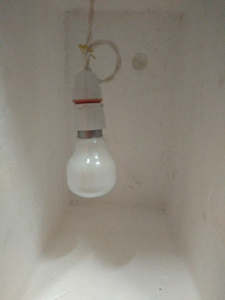
| + | The light turns ON automatically post sunset and OFF post sunrise hence cutting down on use of unnecessary electricity. | ||
| − | [[File: | + | [[File:IMG20170407194739.jpg|300px]] [[File:IMG20170407194748.jpg|300px]] |
Latest revision as of 00:24, 10 April 2017
Contents
- 1 INTRODUCTION TO ELECTRONICS
- 2 CIRCUITS AND CODING
- 3 PROJECTS
- 3.1 Spinning cup
- 3.2 Field visit
- 3.3 Turbidity meter
- 3.4 Extension to human body in future
- 3.5 Languages spoken in Bangalore
- 3.6 Arduino and Processing
- 3.7 Blinking an LED 5 times
- 3.8 Let the serial monitor ask you the question
- 3.9 LED blink with respect to LDR
- 3.10 LEDs and moisture sensor
- 3.11 Smart Light (Final Project)
INTRODUCTION TO ELECTRONICS
Arduino
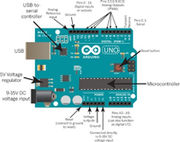
Arduino is an open-source electronics platform based on easy-to-use hardware and software. Arduino boards are able to read inputs - light on a sensor, a finger on a button, or a Twitter message - and turn it into an output - activating a motor, turning on an LED, publishing something online. An Arduino can be powered directly off of a USB port without any external power. It can also be connected to an external power source of up to 12v and it will regulate it to both 5v and 3.3v. Arduino has 32 KB of flash memory for storing a code. It has 13 digital pins and 6 analog pins. These pins allows connection of external hardware to the Arduino. And it has a button to reset the program on the chip.
Arduino IDE (integrated development environment) needs to be downloaded and installed before doing anything with the arduino. The Arduino Programmer is based on the Processing IDE and uses a variation of the C and C++ programming languages.
Sensors
A sensor is a device that detects and responds to some type of input from the physical environment. The specific input could be light, heat, motion, moisture, pressure etc. For example, In a mercury-based glass thermometer, the input is temperature. The liquid contained expands and contracts in response, causing the level to be higher or lower on the marked gauge, which is human-readable. Sensors are found in everyday objects such as touch sensitive phones, automatic doors, home security lights etc.
Light Dependent Resistor (LDR)
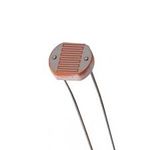
An LDR or light dependent resistor is also known as photo resistor, photocell, photoconductor.It is a one type of resistor whose resistance varies depending on the amount of light falling on its surface. When the light falls on the resistor, then the resistance changes. These resistors are often used in many circuits where it is required to sense the presence of light. These resistors have a variety of functions and resistance. For instance, when the LDR is in darkness, then it can be used to turn ON a light or to turn OFF a light when it is in the light.
Potentiometer
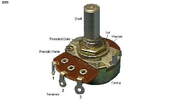
A potentiometer, informally a pot, is a three-terminal resistor with a sliding or rotating contact that forms an adjustable voltage divider.
Circuit
Resistance
Series resistance
In a series circuit, the resistors are placed in a chain hence the current has only one path to take. The current is same through each resistor whereas the volatage across each resistance changes. If for example, in a circuit with three resistors of 8 ohm, 8 ohm and 4 ohm, voltage of 10 V, total resistance would be 20 ohm ( sum of all resistors). Then using ohm’s law ( V=IR), current (I) would be 0.5 A.
Parallel resistance
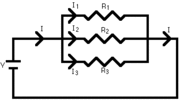
In parallel circuit, the resistors are placed parallel to each other hence the current breaks up and re-combines. The voltage is same across each resistor whereas the current splits. . If for example, in a circuit with three resistors of 8 ohm, 8 ohm and 4 ohm, voltage of 10 V, total resistance would be 2 ohm (sum of reciprocal of individual resistors). Then using ohm’s law, total current would be 5 A. The individual resistors would be 1.25 A, 1.25 A and 2.5 A.
As seen in the example above, the total resistance in series is more as compared to total resistance in parallel which is why the current flowing through series is lesser that the current flowing through parallel. Therefore, a series resistance is created to increase resistance in a circuit and parallel to decrease resistance.
CIRCUITS AND CODING
How to make an LED blink?
Basic circuit
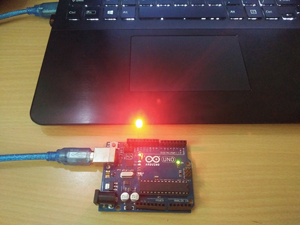
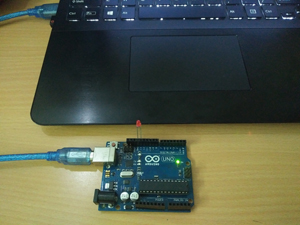
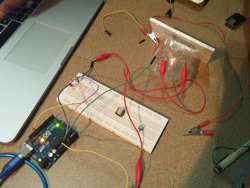
Making an LED blink was the most basic circuit we started with. For this, an LED was inserted in the Arduino, shorter leg going in GND and the longer one in digital pin 13 (output). We used the example blink code from the software to try it out. We also played around with the delay to have the LED blink at different paces.
Using a potentiometer
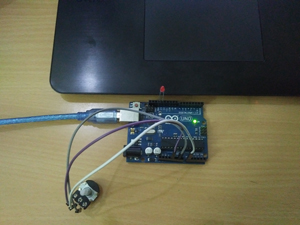
To make an LED blink with an analog input i.e. the potentiometer, we used the code for analog input. According to the code, the analog input would get signals from A0. In any analog 3 legged sensor, the middle leg goes to analog input and the other two go to GND and power (5V). The LED is directly inserted in Arduino in GND and digital 13. The pace at which LED blinked changed according to the reading from the potentiometer.
How to use an IR sensor?
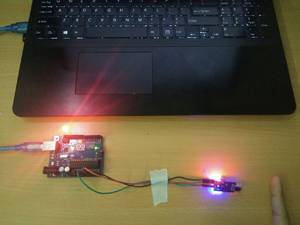
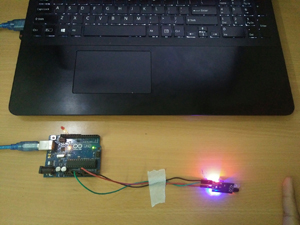
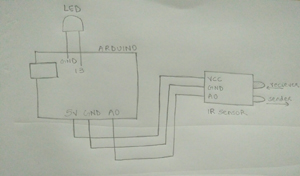
An IR proximity sensor works by applying a voltage to a pair of IR light emitting diodes (LED’s) which in turn, emit infrared light. This light propagates through the air and once it hits an object it is reflected back towards the sensor. If the object is close, the reflected light will be stronger than if the object is further away. The sensing unit detects the reflected infrared light, and if its intensity is strong enough, the circuit becomes active. When the sensing unit becomes active, it sends a corresponding signal to the output terminal which makes the LED glow.
Reflection
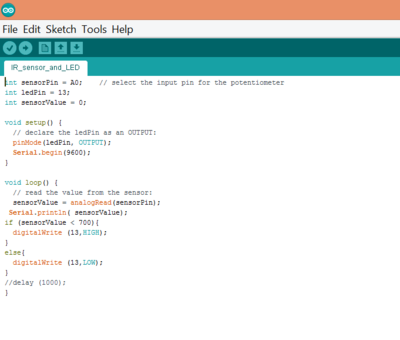
After understanding what an IR sensor means and what it actually does, I started looking for it’s connections with the Arduino and code online. Not having much knowledge about the same, I followed what a youtube video asked me to do. After making all connections and uploading the code, the sensor didn’t work. I re-did the connection and code taking help from someone. I understood that in an IR sensor, VCC is connected to power i.e. 5V, GND is connected to GND on Arduino and the AO is connected to any Analog pin on Arduino from 0 to 5. The same input is defined in the code. On the digital side, the smaller (negative) leg of the LED is inserted in GND and the longer(positive) leg is inserted in any digital pin from 0 to 13. The same output is defined in the code. Also, the range till where the IR sensor should detect an obstacle needs to be defined.
PROJECTS
Spinning cup
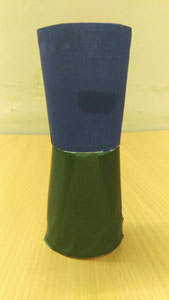
Not knowing much about coding and circuits yet, I helped the team making the spinning cup with the structure. The basic circuit included a motor that the glass was stuck on, a potentiometer that changed the speed of rotation and an Arduino that gave these two sensors some information to function the way they did.
Process images
The spinning cup
Field visit
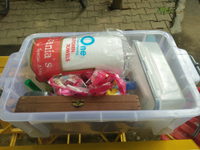
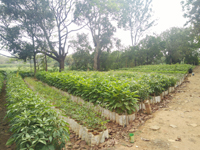
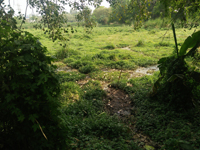
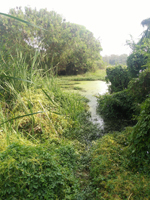
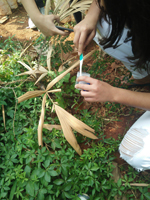
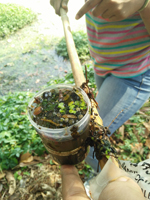
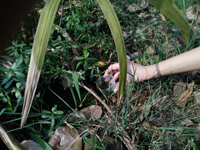
The purpose of our visit to the lake was to collect some water samples and look for diatoms in it. Before going, we made a list of things we would need there. This list included beakers, dropper, tissue, toothbrush, labels, pens etc. After making the list and preparing a kit, we headed to Puttanahalli lake. There we collected 6-7 samples of water from different sources. Here we realised that a laddle with a long handle would be very useful. We also made one there using stick, beaker and thread.
Preparing the kit.
Images of the surrounding at the lake.
Collecting water samples.
Turbidity meter
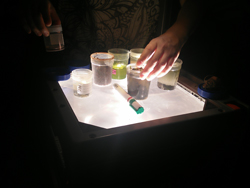
After examining the turbidity of the water samples collected from the lake using an overhead projector, we were given the task to make our own turbidity meters. I was a little confused in the beginning as to how we would do that. But after discussion, I realised that all we need to make a turbidity meter is a Light sources, an LDR and a space to keep the liquid in. The amount of light actually passing through the liquid and reaching the LDR decided how turbid the liquid is.
Samples collected and viewed through projection and microscope.
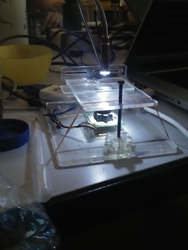
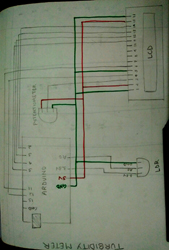
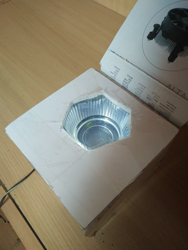
We started making our turbidity meters in groups. We used a small bicycle light as a light source. The connections between LDR and Arduino were simple. One leg of the LDR was connected to resistance. This leg went to analog input and the other two legs went to GND and power. We decided to display our readings on an LCD. We took reference to figure out the connections between LCD and Arduino.
Making of turbidity meter.
Readings when source light on and off.
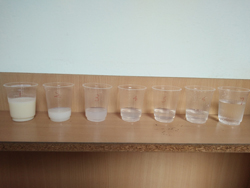
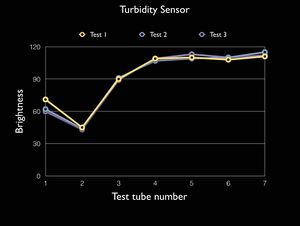
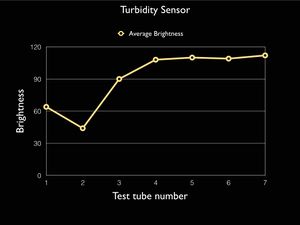
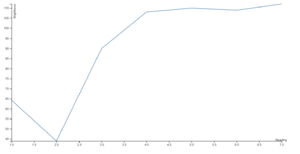
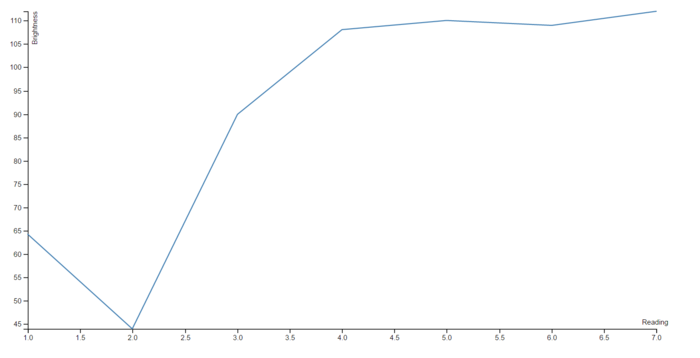
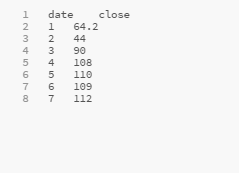
After preparing 7 solutions of different concentrations of milk and water, we noted down three readings for each solution, took an average and plotted it on the graph.
Graphs showing average readings.
Line chart for Turbidity meter
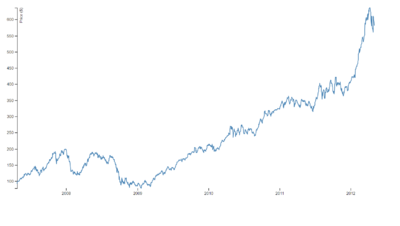
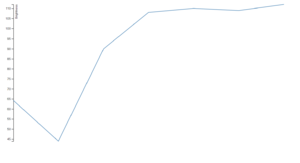
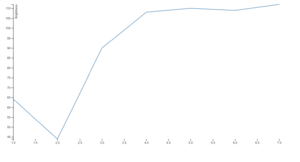
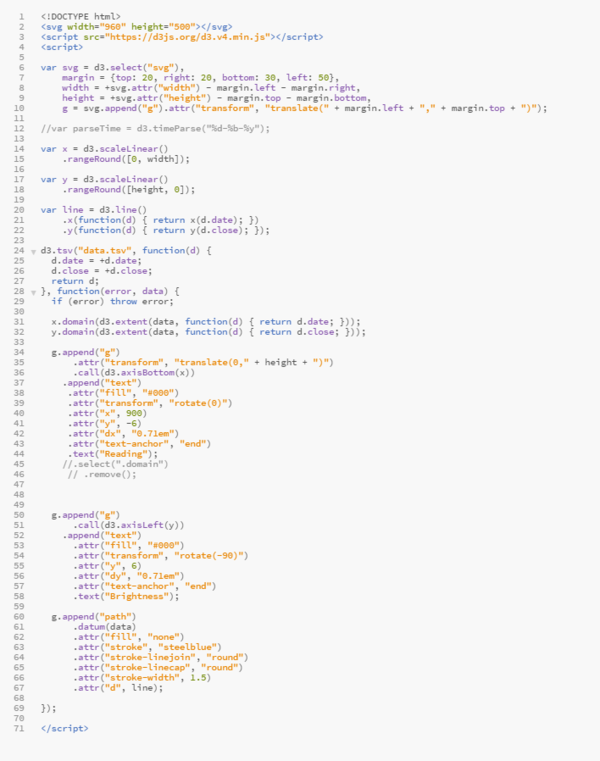
After studying the line chart on D3, a JavaScript library for producing dynamic, interactive data visualizations in web browsers, we made a line chart for the turbidity meter built earlier. For this, we saved the same code and data for the line chart on D3 and modified it. We had to download a text editor that doesn’t change the format of the file when saved. I faced problem using “Sublime” since it didn’t work for windows. I then downloaded “Brackets”, copied the code and went ahead with modifying it. The code being in java script, I faced problems understanding it. But when I started decoding and experimenting with it, it became easy. I modified one thing at a time and saw what changes that modification made in the graph. This was a complete trial and error process for me. Slowly, I got the hang of it and started enjoying the process.
Attempts
Final
Extension to human body in future
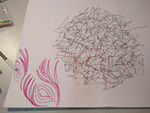
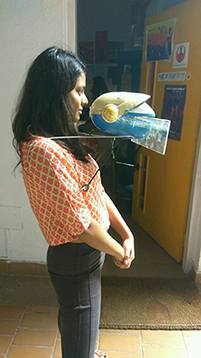
After sketching what the terms “cyborg” and “post human” mean to us, we went around in groups to look for scrap out of which we were supposed to build an extension to human body in 10 years. We made an extended mouth that would be connected to the brain and heart of the user and would do the talking when the user doesn’t want to or to save energy. This extended mouth also has a screen attached to it which would convert the words into text for deaf people to read.
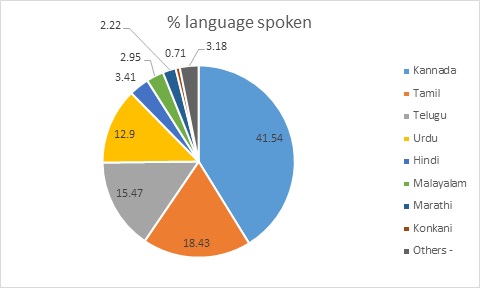
Languages spoken in Bangalore
Arduino and Processing
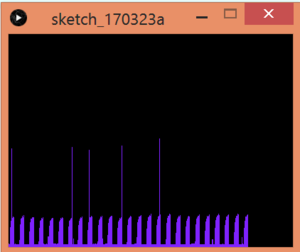
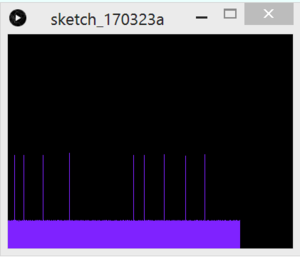
We used software called “Processing” to visually depict the serial monitor’s readings. For this, we used LDR, the most basic sensor. Depending on how much light fell on the LDR, the serial monitor readings kept changing. When Arduino was linked to Processing and the same code was given to Processing in it’s language, we achieved a visual depiction for the same readings where the reading decided the height of the line.
This was an interesting exercise. Even though the way the code is written in Processing was different from how it’s written in Arduino, I could understand some parts of it and make changes to achieve different results.
Blinking an LED 5 times
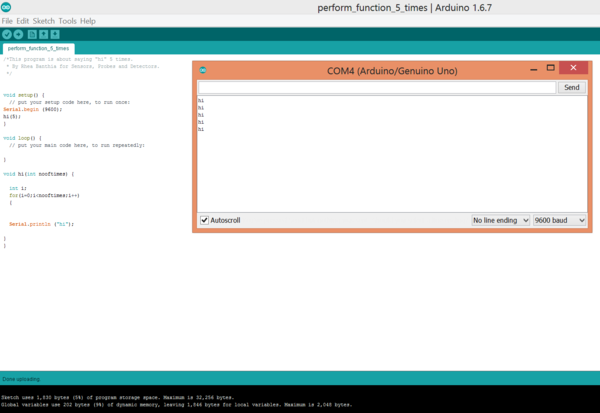
The task for the day was to make the serial monitor say something or make an LED blink for a specific number of times. For this, we created the code which made the serial monitor display a defined dialogue 5 times. The code is shown in the image below.
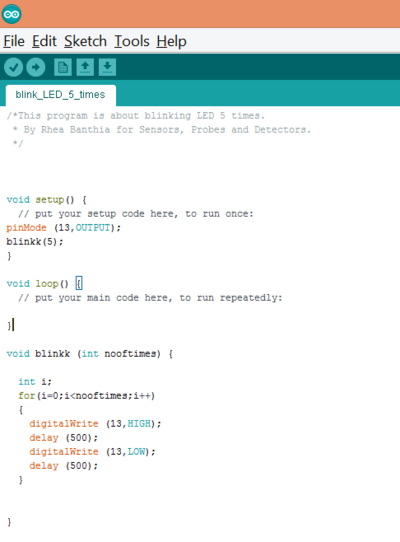
After this, we were supposed to figure out a way to make the LED blink 5 times. I made changes in the code accordingly and had the LED blink 5 times. This wasn't very difficult to achieve. I just had to replace that part of the code that makes the serial monitor display something 5 times with a code that make the LED blink 5 times instead.
Let the serial monitor ask you the question
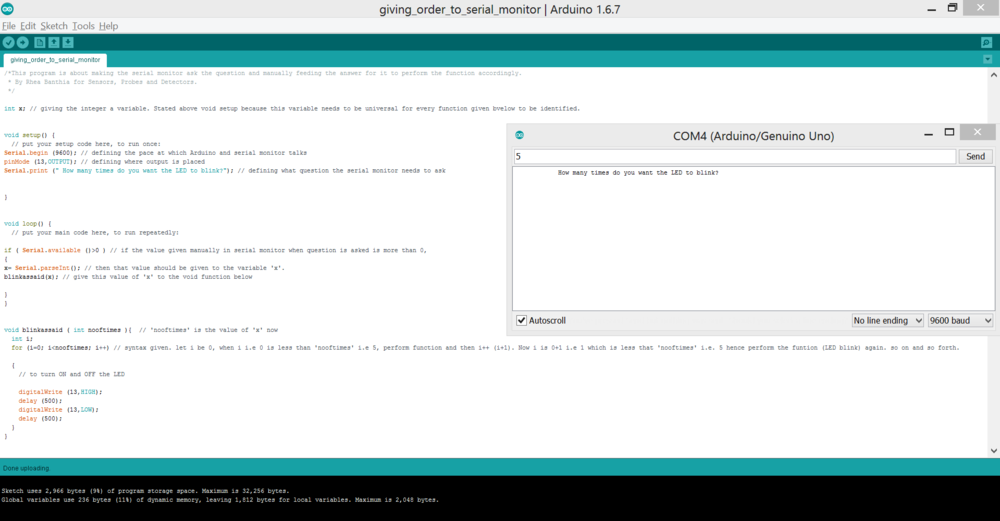
Code with detailed description for each line.
LED blink with respect to LDR
LEDs and moisture sensor
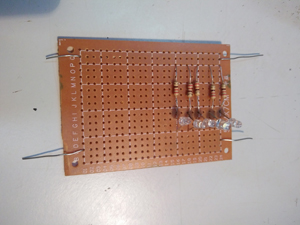
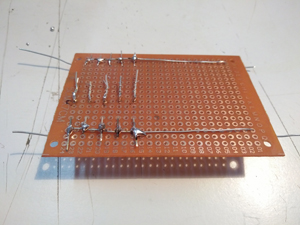
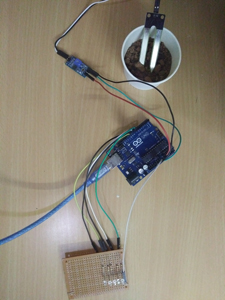
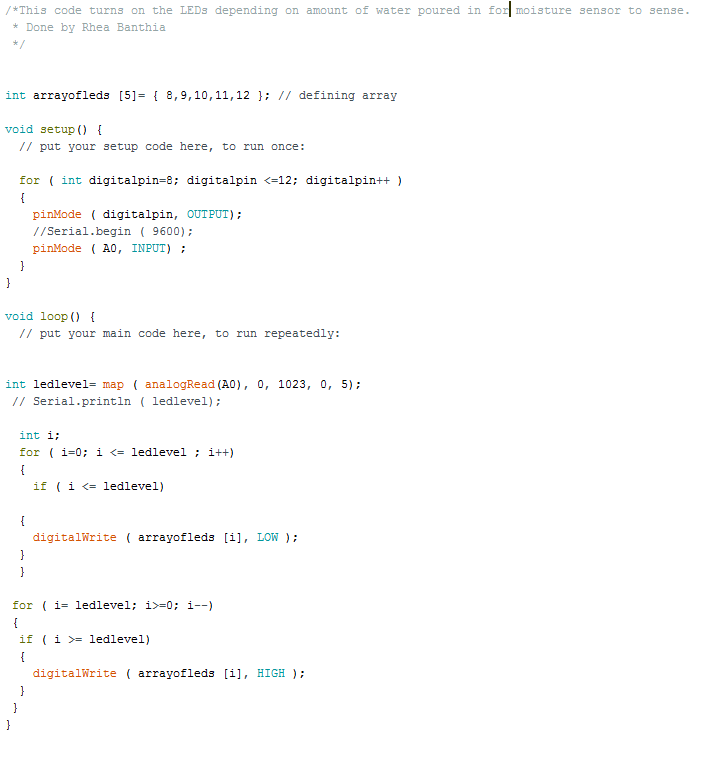
The task was to make 5 LEDs glow depending on the reading of sensor used. I used a moisture sensor for the same. We first learnt soldering and prepared a circuit of LEDs on a perf board. Each LED had a common ground connection but a separate connection to the pins as all of them were supposed to glow separately. For this, we used an array command.
The LEDs in the circuit glowed one by one depending on the amount of moisture in the plant.
Here's the code for the same.
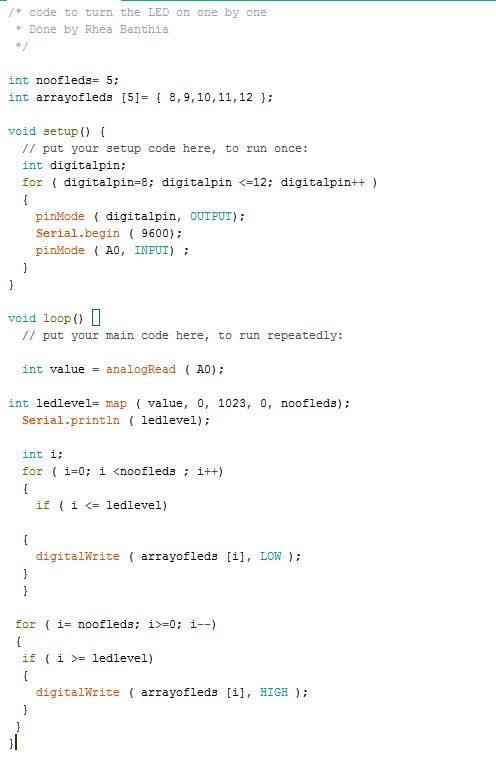
Another code I tried while figuring out the final code
Smart Light (Final Project)
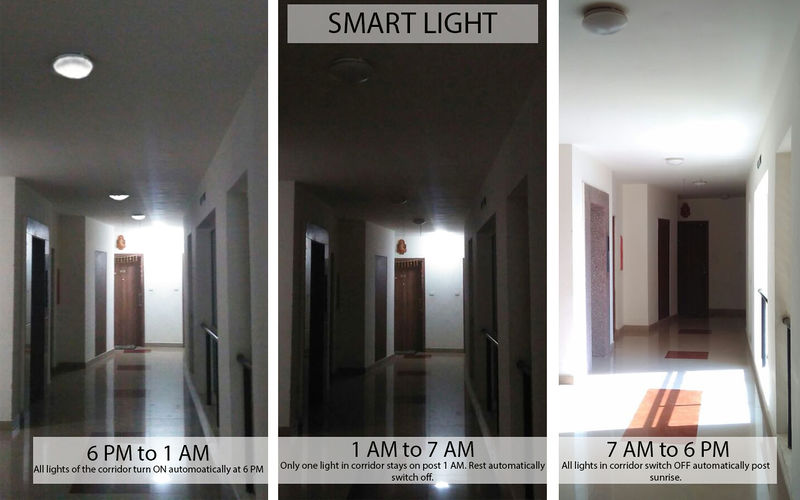
Haven't we all seen corridor lights of a building on even post sunrise? This leads to wastage of so much electricity. This project was my attempt to solve this problem. I wanted to code the lights in such a way that they turn on and turn off automatically depending on what time of the day it is. For this I first did a lot of research and read a lot online to figure out how this can be done as I had no idea about it. I read about Arduino's internal clock, tried a few things as directed by different sites, but, nothing worked. I was told that the Arduino UNO does not have a real time internal clock. But, it can read time from the laptop. I used a code on processing which enabled the Arduino to read the time from my laptop and wrote a code for the Arduino for the output i.e. LED to turn on when the clock strikes 6 pm and off when it strikes 7 am.
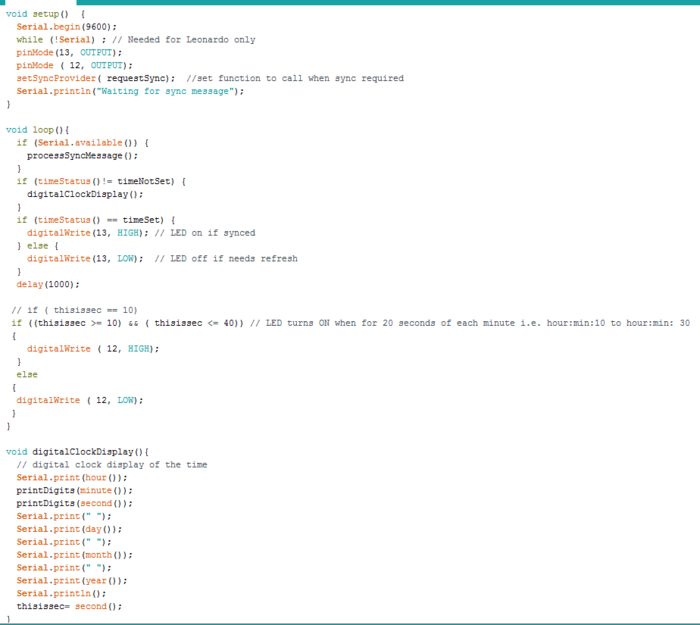
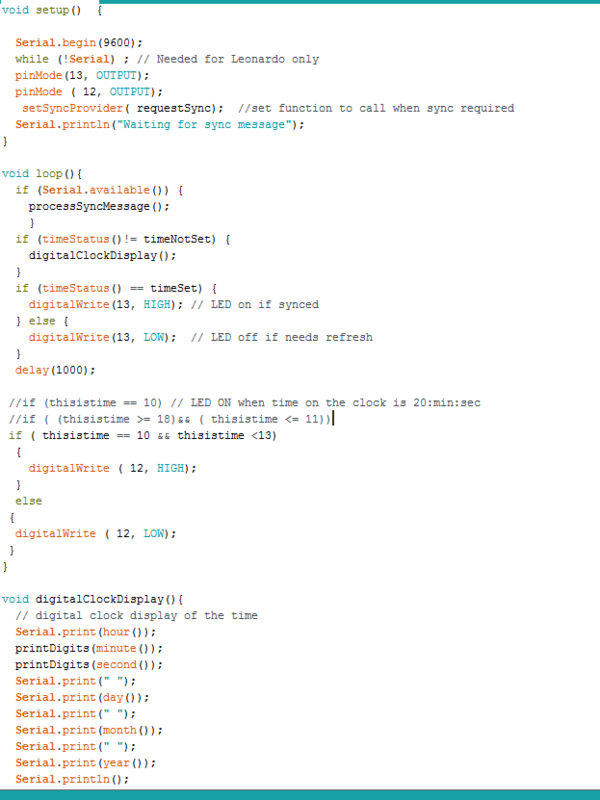
Trial code to turn on and off the Led on a particular second of the minute.
Made changes in trial code from second to hour once it worked. For some reason, the exact same syntax that worked for seconds did not work for hours, hence tried different things to fix that.
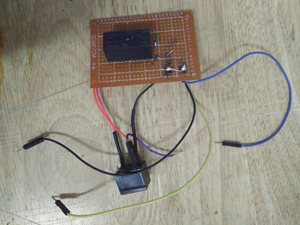
After figuring out the code, I had to shift from an LED to a bulb. Since the bulb uses so much more power than what the Arduino provides, I had to use something called a relay. I read about the relay and it's connections, soldered the connections, tried all permutations and combinations, but, for some reason it just didn't work.
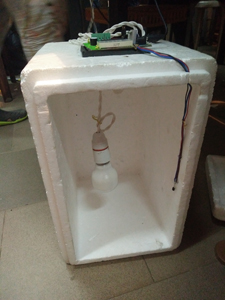
Used another circuit to make the bulb work
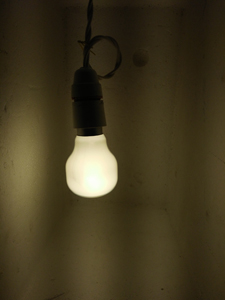
The light turns ON automatically post sunset and OFF post sunrise hence cutting down on use of unnecessary electricity.
