Difference between revisions of "Janvi Mehta"
Janvi mehta (Talk | contribs) (→ECG Sensor) |
Janvi mehta (Talk | contribs) (→An Interactive fun house) |
||
| (159 intermediate revisions by one user not shown) | |||
| Line 1: | Line 1: | ||
=Introduction= | =Introduction= | ||
| − | Hey, I am Janvi Mehta, second Year IAIDP (Information Arts and Information Design Practices) student. I am interested in branding, book layout, Illustrations and to keep learning new softwares. I like to explore, travel and know different things. I found interest in arduino and sensors since my first arduino class in foundation. This course started with a brief introduction of the projects, done in the previous course of Sensors,Probes and Detectors. The projects were too interesting, they had made some amazing things like a Turtle, Nano Satellite, Plant Interface and DIY Pollution sensor. After seeing these project ideas and when I came to know that this being the advanced version of the previous course, it increased my excitement level, to learn new things and to make interactive projects through hands-on workshop, building our own sensors. | + | [[File:Face.jpg|border| thumb|80 px]] |
| + | |||
| + | Hey, I am Janvi Mehta, second Year IAIDP (Information Arts and Information Design Practices) student. I am interested in branding, book layout, Illustrations and to keep learning new softwares. I like to explore, travel and know different things. I found interest in arduino and sensors since my first arduino class in foundation. This course started with a brief introduction of the projects, done in the previous course of Sensors,Probes and Detectors. The projects were too interesting, they had made some amazing things like a Turtle, Nano Satellite, Plant Interface and DIY Pollution sensor. After seeing these project ideas and when I came to know that this being the advanced version of the previous course, it increased my excitement level, to learn new things and to make interactive projects through hands-on workshop, building our own sensors. | ||
| + | |||
| + | |||
| + | |||
| + | |||
=Sensors and Circuits= | =Sensors and Circuits= | ||
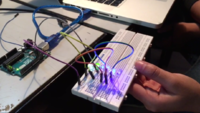
| − | I was introduced to the basics, starting with the circuit of '''LED (light emitting diode)''', where one of the connection is to the ground and the other onto, one of the output pin. With the help of the inbuilt codes, we made the '''LED blink''', kept changing the delay values to make it blink faster or slower. | + | I was introduced to the basics, starting with the circuit of '''LED (light emitting diode)''', where one of the connection is to the ground and the other onto, one of the output pin. With the help of the inbuilt codes, we made the '''LED blink''', kept changing the delay values to make it blink faster or slower. |
| + | |||
| + | |||
| + | [[File:Hi.png|200px||border]] | ||
| + | |||
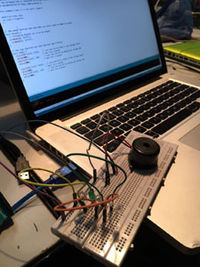
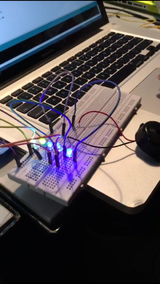
We learnt the use of bread board, where few connections are horizontal, few being vertical . With the help of it, I further added more LED’s, joining one of the connection with the ground and the other with the respective output pins and made it blink altogether. To this set up, we added the '''piezo buzzer''' , where one of the connection was to the ground and other to the respective pin (according to the coding). We managed to put the values in such a way, that the buzzer and the blinking work simultaneously. | We learnt the use of bread board, where few connections are horizontal, few being vertical . With the help of it, I further added more LED’s, joining one of the connection with the ground and the other with the respective output pins and made it blink altogether. To this set up, we added the '''piezo buzzer''' , where one of the connection was to the ground and other to the respective pin (according to the coding). We managed to put the values in such a way, that the buzzer and the blinking work simultaneously. | ||
| − | |||
| − | LDR | + | [[File:IMG-20170306-WA0009.jpg|200px|buzzer]] [[File:Onn.png|160px]] |
| + | |||
| + | |||
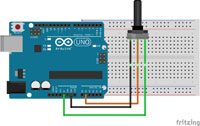
| + | The measuring instrument called a '''potentiometer''' is essentially a voltage divider used for measuring electric potential (voltage). Potentiometers are commonly used to control electrical devices such as volume controls on audio equipment. We connected the three wires of the Potentiometer to the aurduino board. The first goes to the ground from one of the outer pins, the second goes from the 5 volts, the third goes from any analog input to the middle pin. As I changed the frequency of the potentio meter, the LED’s blinked according to that pace and the analogValues were seen on the computer, the lowest being 0 and the highest being 1023. I further attached an '''LDR (Light Dependent Resistor)''' to it, so according to the light detected the LED’s blinked. Whenever it got dark the LED’s automatically turned on the light. An LDR is a resistor where the resistance decreases with the strength of the light. | ||
| + | |||
| + | |||
| + | [[File:Potentiometer circuit.jpg]] [[File:LDR circuit.jpg]] | ||
| + | |||
| + | |||
IR | IR | ||
| + | |||
| + | |||
| + | [[File:IR sensor circuit.gif]] | ||
| + | |||
'''Reflection''' | '''Reflection''' | ||
| + | |||
| + | All these sensors are always around us, such creative things can be made with such a simple connection .I found all these codes and connection easy and I am looking forward for more complex things during the five week course and aim on making an interactive product. | ||
=Understanding the Basics= | =Understanding the Basics= | ||
'''Reflection''' | '''Reflection''' | ||
| + | |||
| + | [[File:Ohms law.jpg|200px|thumb]] | ||
| + | |||
| + | It was a revision of what I had learnt in our school physics classes. We learnt the basic circuits and understood the terms Current (ampere), Resistance (R) , Voltage (Volt); The formula for Ohm’s law, being ( V= I*R) was taught through various examples. I completely understood the concepts especially after the examples. I further learnt the difference between the series and parallel connections. | ||
| + | |||
| + | |||
| + | |||
| + | |||
| + | |||
| + | |||
| + | |||
| + | |||
| + | |||
| + | |||
| + | |||
===Series Connection=== | ===Series Connection=== | ||
In Series connection, the charge will pass through every light bulb. A series circuit can be constructed by connecting light bulbs in such a manner that there is a single pathway for charge flow. As more and more light bulbs are added, the brightness of each bulb gradually decreases. If one of three bulbs in a series circuit is unscrewed from its socket, then it is observed that the other bulbs immediately go out. In order for the devices in a series circuit to work, each device must work. | In Series connection, the charge will pass through every light bulb. A series circuit can be constructed by connecting light bulbs in such a manner that there is a single pathway for charge flow. As more and more light bulbs are added, the brightness of each bulb gradually decreases. If one of three bulbs in a series circuit is unscrewed from its socket, then it is observed that the other bulbs immediately go out. In order for the devices in a series circuit to work, each device must work. | ||
| + | |||
| + | |||
| + | [[File:Parallel, series.jpg|100px]] | ||
| + | [[File:Paralllel.jpg|200 px]] | ||
| + | [[File:Seriess.jpg|200px]] | ||
===Parallel Connection=== | ===Parallel Connection=== | ||
| Line 35: | Line 78: | ||
The intention of our trip to the lake was to collect water samples and look for diatoms in it. For our trip we first made a list of things to take with us, like tape, toothbrush, gloves, clean water, tissues, labels, cloth, test tubes, dropper, containers , markers etc. We collected around 7-8 samples from different ares. Made a laddle with a stick and thread to find samples from the depth. | The intention of our trip to the lake was to collect water samples and look for diatoms in it. For our trip we first made a list of things to take with us, like tape, toothbrush, gloves, clean water, tissues, labels, cloth, test tubes, dropper, containers , markers etc. We collected around 7-8 samples from different ares. Made a laddle with a stick and thread to find samples from the depth. | ||
| + | |||
| + | Preparing the kit: | ||
| + | |||
| + | [[File:Kit.jpg|150 px]] [[File:IMAG0522.jpg|150px]] | ||
| + | |||
| + | Around the Lake: | ||
| + | |||
| + | [[File:Around the lake.jpg|150 px]] [[File:IMG-20170308-WA0014.jpg|150 px]] [[File:IMG-20170308-WA0008.jpg|150 px]] | ||
| + | |||
| + | Sample collection: | ||
| + | |||
| + | [[File:First .jpg|150 px]] [[File:Secomnd.jpg|150 px]] [[File:Third.jpg|150 px]] [[File:Fourth.jpg|150 px]] | ||
| + | |||
| + | [[File:Fourth fifth.jpg|150 px]] [[File:Fifth.jpg|150 px]] [[File:IMG20170307150917.jpg|150 px]] | ||
| + | |||
| + | |||
'''Reflection''' | '''Reflection''' | ||
| Line 56: | Line 115: | ||
- Arduino | - Arduino | ||
| + | |||
| + | |||
| + | Circuit and readings: | ||
| + | |||
| + | |||
| + | [[File:Connections.png|200 px]] [[File:Circuit.png|200 px]] | ||
| + | |||
| + | [[File:Arduinnno.png|200px]] [[File:REadings.png|200px]] | ||
| + | |||
| + | |||
| + | Process: | ||
| + | |||
| + | |||
| + | [[File:Cupos.jpg|150px]] [[File:Outer.jpg|150 px]] [[File:Wires.jpg|250 px]] | ||
| + | |||
| + | |||
| + | Final prototype: | ||
| + | |||
| + | |||
| + | [[File:Last.jpg|150 px]] [[File:Sauce.jpg|150 px]] [[File:Sauce 2.jpg|150 px]] | ||
| + | |||
| + | {{#ev:youtube|8LihAEqWh4A}} | ||
| + | |||
'''Reflection''' | '''Reflection''' | ||
| Line 62: | Line 144: | ||
== ECG Sensor== | == ECG Sensor== | ||
| − | We were then given Sensors to explore like the Pulse Sensor, Vibration Sensor, Heart Pulse, ECG Sensor, Motion Sensor, LDR sensor, IR Sensor, Carbon Dioxide and Sound sensor. | + | An Electrocardiogram is a graphic produced by an electrocardiograph, which records the electrical voltage produced by the beating of the heart muscle in the form of a continuous strip graph. It is the prime tool in cardiac electrophysiology and has a prime function in screening and diagnosis of cardiovascular disease. We were then given Sensors to explore like the Pulse Sensor, Vibration Sensor, Heart Pulse, ECG Sensor, Motion Sensor, LDR sensor, IR Sensor, Carbon Dioxide and Sound sensor. |
| + | |||
| + | - Arduino | ||
| + | |||
| + | - Jumper wires | ||
| + | |||
| + | - ECG Electrode Connector | ||
| + | |||
| + | - ECG Electrodes - 3 pieces | ||
| + | |||
| + | |||
| + | |||
| + | [[File:ECG Sensor.png|200 px]] [[File:Ecg .jpg|200 px]] | ||
| + | |||
| + | |||
| + | [[File:Wires.jpg|200 px]] [[File:Docu.jpg|200 px]] | ||
| + | |||
| + | |||
| + | [[File:3 pins.jpg|200 px]] [[File:Hands.jpg|2pp px]] | ||
| + | |||
| + | |||
| + | |||
| + | [[File:Readis.png|250 px]] | ||
| + | |||
| + | |||
'''Reflection''' | '''Reflection''' | ||
| Line 69: | Line 175: | ||
==Turbidity Meter== | ==Turbidity Meter== | ||
| + | |||
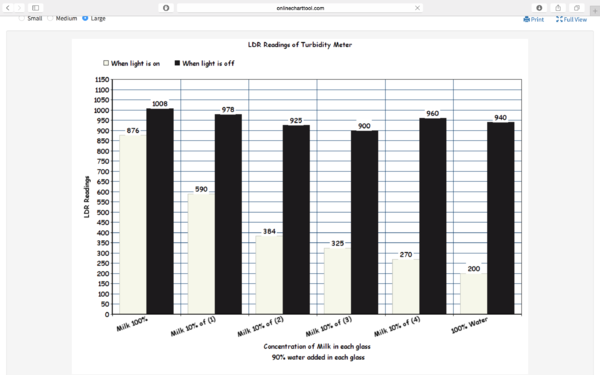
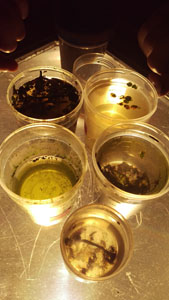
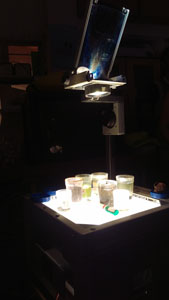
| + | The turbidity sensor detects water quality by measuring the levels of turbidity. It uses light to detect suspended particles in water by measuring the light transmittance and scattering rate. We had tried it with 6 solutions made with water and milk. We had put it in a box to keep it dark and then provided light from one side. It worked perfectly, the variations in the reading were relatable to the solution we kept in the glass. | ||
| + | |||
| + | - LDR Sensor | ||
| + | |||
| + | - Resistor | ||
| + | |||
| + | - Arduino | ||
| + | |||
| + | - Jumper wires | ||
| + | |||
| + | - Glasses | ||
| + | |||
| + | - Light source (torch) | ||
| + | |||
| + | |||
| + | Process while making the Turbidity Meter: | ||
| + | |||
| + | [[File:Process of turb.jpg|150 px]] [[File:Taped.jpg|150 px]] [[File:Soler.jpg|300 px]] [[File:Innerr.jpg|300 px]] | ||
| + | |||
| + | |||
| + | |||
| + | Solutions prepared to check it's Turbidity: | ||
| + | |||
| + | [[File:Milk and water.jpg|300 px]] [[File:D.jpg|300 px]] | ||
| + | |||
| + | |||
| + | |||
| + | Solution with Milk and one of the sample of lake water: | ||
| + | |||
| + | |||
| + | [[File:With milk.jpg|150 px]] [[File:Lake water.jpg|150 px]] | ||
| + | |||
| + | |||
| + | Graph: | ||
| + | |||
| + | |||
| + | [[File:Graph tur.png|600px]] | ||
| + | |||
'''Relfection''' | '''Relfection''' | ||
| + | |||
| + | I learnt how the turbidity is sensed and if I want to do that with drinking water or lake water it would be a great experiment to do and analysing it. I enjoyed the entire process, had few difficulties deciding the outer appearance and tried various things. | ||
= Beyond Electronics= | = Beyond Electronics= | ||
| + | |||
| + | We (human and non-human) all sense our environments, without the mediation of electronic instruments. | ||
| + | What if our sensors, probes, and detectors are alive? | ||
| + | |||
| + | We set out to explore on a more conceptually expanded scale, what it means to sense, probe, and detect our environments and the inhabitants within. | ||
| + | |||
| + | We were shown various projects done under biodesign using arduino, where they combined nature and art. I was very astonished to see how it works, they had made sensors to detect plants or parts of the skin. Showed us a jugaad sensor, water Quality site done by ArtScience Bangalore team, which shows the percentage of fluoride, nitrate, Ph in the water. Everyone brainstormed and wrote a list of sensors which are alive like hair on our body that stands due to friction, touch me not plants, plankton, electric eal, genetical evolution, vibro, photo bacterium, algae, glow in the dark worms,etc. We then observed the water samples in the microscope and saw how in such a tiny drop of water were the micro organisms living and moving. | ||
| + | |||
| + | |||
| + | [[File:IMAG0565.jpg|200 px]] [[File:IMAG0574.jpg|200 px]] [[File:IMAG0561.jpg|200 px]] [[File:IMAG0576.jpg|200 px]] | ||
| + | |||
| + | [[File:IMAG0564.jpg|150 px]] | ||
| + | |||
| + | |||
| + | =Superpowers= | ||
| + | |||
| + | Collected scrap: | ||
| + | |||
| + | |||
| + | [[File:Materials.jpg]] | ||
| + | |||
| + | |||
| + | |||
| + | [[File:Lungs.jpg]] [[File:Excret.jpg]] [[File:Back.jpg]] | ||
| + | |||
| + | |||
| + | |||
| + | |||
| + | [[File:Process.jpg]] [[File:With ligts.jpg]] | ||
| + | |||
| + | |||
| + | |||
| + | =Data Visualisation= | ||
| + | |||
| + | I researched on total number of non - working women across Bangalore city. In Urban and Rural District 3/4th of women are not working. In South Bangalore 6.8 lakh out of 9.6 lakh women, in North Bangalore 1.25 lakh out of 1.66 lakh women and in East Bangalore 36,900 out of 48,908 women are not working. The Bangalore map shows the data visually. Per unit is 20,000 non working women. | ||
| + | |||
| + | |||
| + | [[File:Map bangalore11.jpg|500 px]] | ||
| + | |||
| + | |||
| + | The datas per areas are as follows: | ||
| + | |||
| + | [[File:Try.png|500 px]] | ||
| + | |||
| + | |||
| + | I have taken out the percentage of total non working women according to the data found for a better understanding: | ||
| + | |||
| + | [[File:Percentage.png|350 px]] | ||
| + | |||
| + | |||
| + | These datas made me realise that we need to motivate women to work . Bangalore being such a large city with so much population is lacking in matter, especially in rural areas. | ||
| + | |||
| + | = Line chart= | ||
| + | |||
| + | A line chart was created using D3.js. It was the first time when I was working with html. I downloaded Sublime Text and saved coding as index.html and datas as data.tsv. Initially, I didn't understand the coding but with some help, I managed to get the Turbidity Meter serial monitor reading in the form of a Line Chart. | ||
| + | |||
| + | [[File:Use.png|600 px]] | ||
| + | |||
| + | |||
| + | The coding is as follows: | ||
| + | |||
| + | [[File:Screen Shot 2017-03-17 at 11.40.16 am.png|500 px]] | ||
| + | |||
| + | [[File:Screen Shot 2017-03-17 at 11.40.27 am.png|300 px]] | ||
| + | |||
| + | =Processing Graph through LDR= | ||
| + | |||
| + | I did the connections of LDR, connecting one end of the resistor with ground, one with 5v and the middle with the analog output. By using the processing graph code, the LDR readings were seen on the screen as a graph. There was a separate code for Processing and Arduino. The graph came according to the light getting detected onto LDR. The pattern in the graph looked interesting. | ||
| + | |||
| + | [[File:Graph proce2.png|400 px]] | ||
| + | |||
| + | |||
| + | [[File:Graph.png|200 px]] [[File:Graph 2.png|200 px]] | ||
| + | |||
| + | =Coding= | ||
| + | |||
| + | |||
| + | ==Blinking LED number of times== | ||
| + | |||
| + | We learnt different codes today. First task was to write something which gets repeated the number of times we want it to. I wrote 'I am a girl' which when given the command, the line displays on serial monitor. In the second task, we had to blink LED five times by writing the code which is shown below. I understood the code properly but there was a problem in writing it myself. | ||
| + | |||
| + | [[File:Screen Shot 2017-03-23 at 2.22.57 pm.png|300 px]] [[File:Screen Shot 2017-03-23 at 2.59.41 pm.png|400 px]] | ||
| + | |||
| + | == Serial monitor asking how many times we want LED to blink== | ||
| + | |||
| + | In this, the code is such that when uploaded , the serial monitor asks us a question and when we manually give the command, the LED blinks that many times. | ||
| + | |||
| + | [[File:Screen Shot 2017-03-23 at 11.59.26 am.png|300 px]] | ||
| + | |||
| + | [[File:Screen Shot 2017-03-23 at 2.47.05 pm.png|300 px]] | ||
| + | |||
| + | ==Leds controlled through a sensor== | ||
| + | |||
| + | We learnt soldering in this task, I had connected the leds to potentiometer, so as the resistance increases, the glow of LEDs will changes. | ||
| + | |||
| + | [[File:IMAG0805.jpg|100px]] [[File:IMAG0807.jpg|100px]] [[File:IMAG0808.jpg|100px]] [[File:IMAG0818.jpg|100px ]] [[File:IMAG0813.jpg|100px]] [[File:IMAG0816.jpg|100px]] | ||
| + | |||
| + | =An Interactive fun house= | ||
| + | |||
| + | The aim of this project was to make an interactive house for children of age 2-5. There are few mechanisms which were controlled through switches and sensors like the gate of the house, shutter of the garage and the lights of the house. | ||
| + | |||
| + | I had thought of various ideas before coming to this, one was to make a robot which can translate languages, a lock mechanism for the house, then we finally ended up with the interactive house. | ||
| + | |||
| + | [[File:New Doc 2017-03-31.jpg|600px ]] | ||
| + | |||
| + | [[File:222222.jpg|200px]] [[File:2cut .jpg|200px]] [[File:3dc connection.jpg|200px]] | ||
| + | |||
| + | We started with making the outer structure | ||
| + | |||
| + | We started by planning the placement and structure of the house, the measurements and the mechanisms. Later, we did the coding part to add a motion sensor and IR sensor for the gate and the garage respectively. | ||
| + | |||
| + | We connected the DC motor to arduino, using transistor and diode. Later added potentiometer to it, to control the speed. Connected the mechanism to the switches, to rotate the motor in clock and anti- clock direction. The codes are as follows: | ||
| + | |||
| + | |||
| + | [[File:4dc code.png|200px]] [[File:5IMAG0877.jpg|200px]] [[File:6IMAG0875.jpg|200px]] | ||
| + | |||
| + | |||
| + | [[File:7IMAG0878.jpg|200px]] [[File:8pulley stick.jpg|200px]] [[File:9trying pulley.jpg|200px]] | ||
| + | |||
| + | The mechanism is as follows. We had great difficultly to figure it out, made pulleys on both sides, tried different types of threads to check which worked perfectly.The mechanism even broke thrice and doing it several times, made me understand the kinds of problems every time and I could learn through it. We made the entire structure with mount-board. | ||
| + | |||
| + | [[File:10making of the shutter.jpg|200px]] [[File:11gate 1.jpg|200px]] [[File:12gare.jpg|200px]] | ||
| + | |||
| + | We made the shutter of the garage with strips of paper and bandage. | ||
| + | |||
| + | [[File:13shutter mech.jpg|200px]] [[File:14shitter mecha.jpg|200px]] [[File:15IMAG0907.jpg|200px]] | ||
| + | |||
| + | [[File:16adding switch .jpg|200px]] [[File:17IMAG0911.jpg|200px]] [[File:18IMAG0918.jpg|200px]] | ||
| + | |||
| + | We further added the switch, instead of IR sensor. I had a hard time figuring out the motor shield as the output of the IR sensor had to be connected with the input of motor shield, which didn't workout unfortunately. | ||
| + | |||
| + | [[File:19inside house.jpg|200px]] [[File:20back isde.jpg|200px]] [[File:21IMAG0933.jpg|200px]] | ||
| + | |||
| + | But the DC motor didn't get enough voltage so, we had to connect it through a 12V battery. | ||
| + | |||
| + | [[File:22IMAG0934.jpg|200px]] [[File:23IMAG0941.jpg|400px]] [[File:24IMAG0943.jpg|400px]] | ||
| + | |||
| + | [[File:25back house.jpg|400px]] [[File:26ghar1.jpg|400px]] [[File:27ghar2.jpg|400px]] | ||
| + | |||
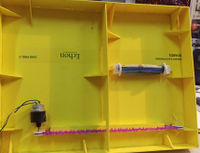
| + | Solar panels , 12 V each were connected to the LEDs for the house. Whenever kept in the sunlight, the LED glows. | ||
Latest revision as of 02:51, 10 April 2017
Contents
Introduction
Hey, I am Janvi Mehta, second Year IAIDP (Information Arts and Information Design Practices) student. I am interested in branding, book layout, Illustrations and to keep learning new softwares. I like to explore, travel and know different things. I found interest in arduino and sensors since my first arduino class in foundation. This course started with a brief introduction of the projects, done in the previous course of Sensors,Probes and Detectors. The projects were too interesting, they had made some amazing things like a Turtle, Nano Satellite, Plant Interface and DIY Pollution sensor. After seeing these project ideas and when I came to know that this being the advanced version of the previous course, it increased my excitement level, to learn new things and to make interactive projects through hands-on workshop, building our own sensors.
Sensors and Circuits
I was introduced to the basics, starting with the circuit of LED (light emitting diode), where one of the connection is to the ground and the other onto, one of the output pin. With the help of the inbuilt codes, we made the LED blink, kept changing the delay values to make it blink faster or slower.
We learnt the use of bread board, where few connections are horizontal, few being vertical . With the help of it, I further added more LED’s, joining one of the connection with the ground and the other with the respective output pins and made it blink altogether. To this set up, we added the piezo buzzer , where one of the connection was to the ground and other to the respective pin (according to the coding). We managed to put the values in such a way, that the buzzer and the blinking work simultaneously.
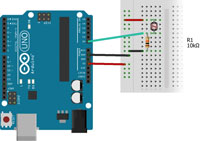
The measuring instrument called a potentiometer is essentially a voltage divider used for measuring electric potential (voltage). Potentiometers are commonly used to control electrical devices such as volume controls on audio equipment. We connected the three wires of the Potentiometer to the aurduino board. The first goes to the ground from one of the outer pins, the second goes from the 5 volts, the third goes from any analog input to the middle pin. As I changed the frequency of the potentio meter, the LED’s blinked according to that pace and the analogValues were seen on the computer, the lowest being 0 and the highest being 1023. I further attached an LDR (Light Dependent Resistor) to it, so according to the light detected the LED’s blinked. Whenever it got dark the LED’s automatically turned on the light. An LDR is a resistor where the resistance decreases with the strength of the light.
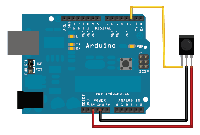
IR
Reflection
All these sensors are always around us, such creative things can be made with such a simple connection .I found all these codes and connection easy and I am looking forward for more complex things during the five week course and aim on making an interactive product.
Understanding the Basics
Reflection
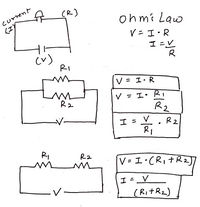
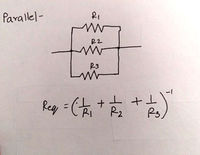
It was a revision of what I had learnt in our school physics classes. We learnt the basic circuits and understood the terms Current (ampere), Resistance (R) , Voltage (Volt); The formula for Ohm’s law, being ( V= I*R) was taught through various examples. I completely understood the concepts especially after the examples. I further learnt the difference between the series and parallel connections.
Series Connection
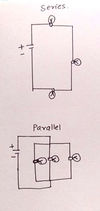
In Series connection, the charge will pass through every light bulb. A series circuit can be constructed by connecting light bulbs in such a manner that there is a single pathway for charge flow. As more and more light bulbs are added, the brightness of each bulb gradually decreases. If one of three bulbs in a series circuit is unscrewed from its socket, then it is observed that the other bulbs immediately go out. In order for the devices in a series circuit to work, each device must work.
Parallel Connection
In parallel circuit, a single charge passing through the external circuit would only pass through one of the light bulbs. The light bulbs are placed within a separate branch line, which provides current through that particular branch. For parallel circuits, as the number of resistors increases, the overall current also increases. This increase in current is consistent with a decrease in overall resistance. If an individual bulb in a parallel branch is unscrewed from its socket, then there is still current in the overall circuit and current in the other branches.
Projects
A field trip to the Lake: Puttanahalli
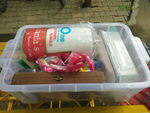
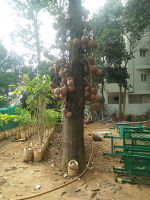
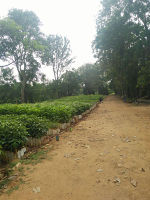
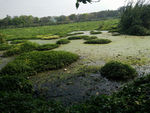
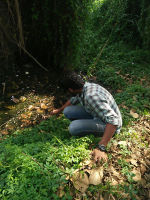
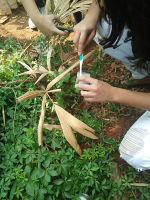
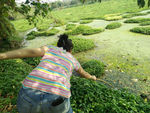
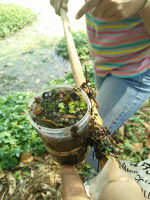
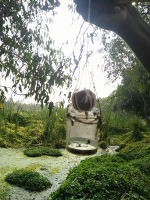
The intention of our trip to the lake was to collect water samples and look for diatoms in it. For our trip we first made a list of things to take with us, like tape, toothbrush, gloves, clean water, tissues, labels, cloth, test tubes, dropper, containers , markers etc. We collected around 7-8 samples from different ares. Made a laddle with a stick and thread to find samples from the depth.
Preparing the kit:
Around the Lake:
Sample collection:
Reflection
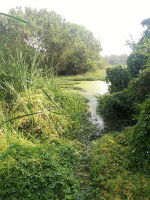
It was a great and a different experience at the lake, we went around and collected water samples from seven to eight different sites. The water was filled with algae and greenery, there were birds chirping and there was plantation all around, the site was pleasing to me as it was peaceful. We collected water samples where ever we found different kinds of water, some being under the shade,leaf, rain water, water with waste, without waste, etc. It was a nice experience through out, I had never imagined myself coming to a lake and collecting water samples for analysing its components. I learnt how to plan things before going for a field trip, working as a team, it widen my thinking process seeing how other think and to implement those learning in future. I am looking forward to explore more and going for these kinds of expeditions.
Spinning Cup
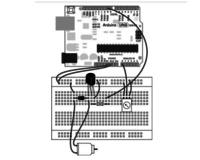
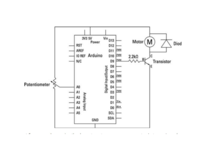
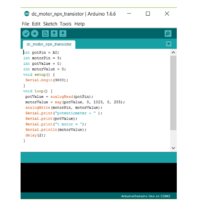
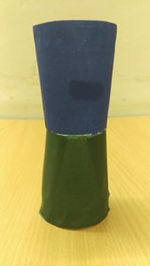
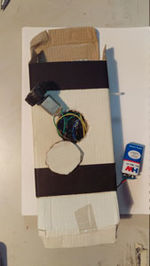
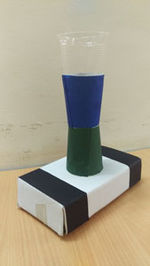
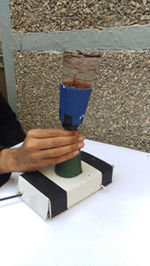
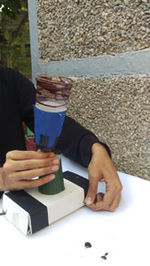
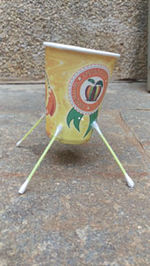
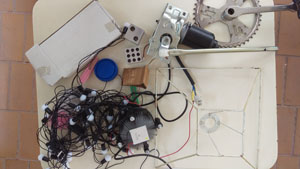
The concept was to create a device to allow café and pastry chefs to do smaller decorations within cups and mugs or even to round off smaller cream domes. The simple mechanism involves a motor with a regulator that can be held easily to allow various orientations as well as speeds. The prototype involves:
- DC motor
- Diode
- Transistor
- Resistor
- Potentiometer
- Arduino
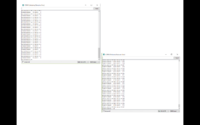
Circuit and readings:
Process:
Final prototype:
Reflection
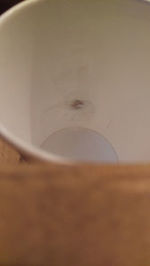
The motor was connected to the holder which will be having the glass and as the frequency of the potentiometer is changed the pace of the motor also increases and decreases forming a pattern inside the glass. We made the outer appearance of the project, finding appropriate boxes, glasses, to hide the arduino, wires, potentio meter, bread board, to make it look more appealing.
ECG Sensor
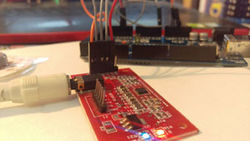
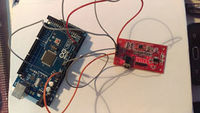
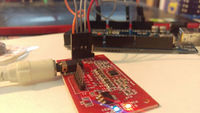
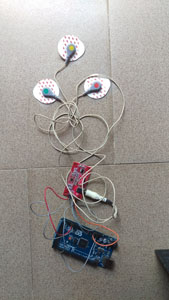
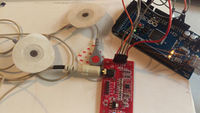
An Electrocardiogram is a graphic produced by an electrocardiograph, which records the electrical voltage produced by the beating of the heart muscle in the form of a continuous strip graph. It is the prime tool in cardiac electrophysiology and has a prime function in screening and diagnosis of cardiovascular disease. We were then given Sensors to explore like the Pulse Sensor, Vibration Sensor, Heart Pulse, ECG Sensor, Motion Sensor, LDR sensor, IR Sensor, Carbon Dioxide and Sound sensor.
- Arduino
- Jumper wires
- ECG Electrode Connector
- ECG Electrodes - 3 pieces
Reflection
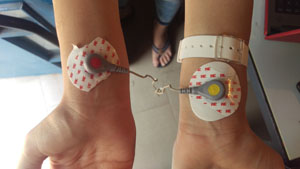
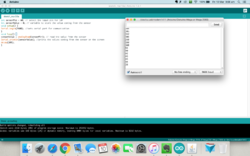
Electrocardiography is used to help diagnose various heart condition. I was admitted few weeks back into the hospital and this is something which I used to think everyday. How great are these technologies, it looked like some rocket science until I made it myself. I had never imagined me making an ECG Sensor ever. I never thought it would be so easy, it looked quite scary to me initially. I was really glad, I could do the connections completely on my own. I had placed the heart pads on both the arms. The cables were coded and had proper placement.
Turbidity Meter
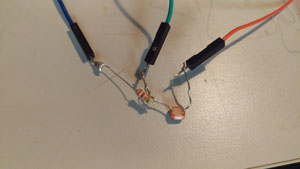
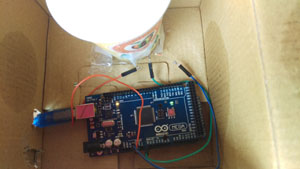
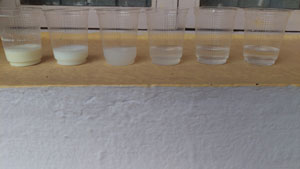
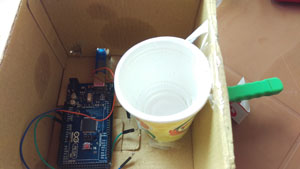
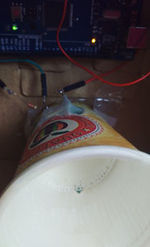
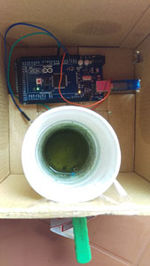
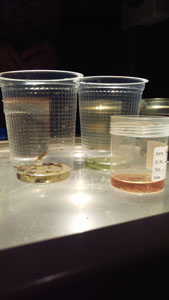
The turbidity sensor detects water quality by measuring the levels of turbidity. It uses light to detect suspended particles in water by measuring the light transmittance and scattering rate. We had tried it with 6 solutions made with water and milk. We had put it in a box to keep it dark and then provided light from one side. It worked perfectly, the variations in the reading were relatable to the solution we kept in the glass.
- LDR Sensor
- Resistor
- Arduino
- Jumper wires
- Glasses
- Light source (torch)
Process while making the Turbidity Meter:
Solutions prepared to check it's Turbidity:
Solution with Milk and one of the sample of lake water:
Graph:
Relfection
I learnt how the turbidity is sensed and if I want to do that with drinking water or lake water it would be a great experiment to do and analysing it. I enjoyed the entire process, had few difficulties deciding the outer appearance and tried various things.
Beyond Electronics
We (human and non-human) all sense our environments, without the mediation of electronic instruments. What if our sensors, probes, and detectors are alive?
We set out to explore on a more conceptually expanded scale, what it means to sense, probe, and detect our environments and the inhabitants within.
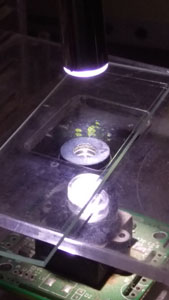
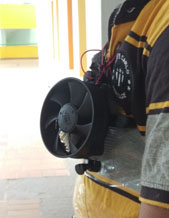
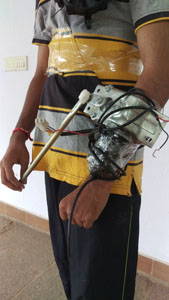
We were shown various projects done under biodesign using arduino, where they combined nature and art. I was very astonished to see how it works, they had made sensors to detect plants or parts of the skin. Showed us a jugaad sensor, water Quality site done by ArtScience Bangalore team, which shows the percentage of fluoride, nitrate, Ph in the water. Everyone brainstormed and wrote a list of sensors which are alive like hair on our body that stands due to friction, touch me not plants, plankton, electric eal, genetical evolution, vibro, photo bacterium, algae, glow in the dark worms,etc. We then observed the water samples in the microscope and saw how in such a tiny drop of water were the micro organisms living and moving.
Superpowers
Collected scrap:
Data Visualisation
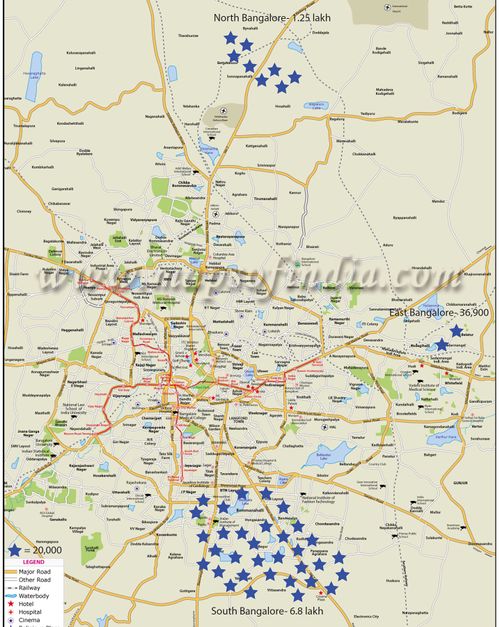
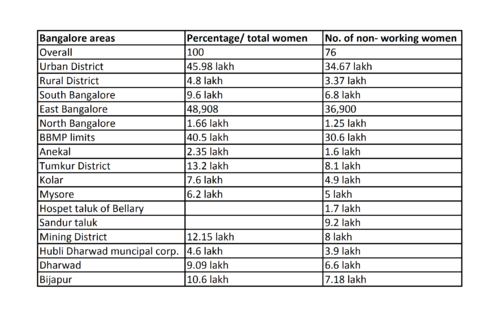
I researched on total number of non - working women across Bangalore city. In Urban and Rural District 3/4th of women are not working. In South Bangalore 6.8 lakh out of 9.6 lakh women, in North Bangalore 1.25 lakh out of 1.66 lakh women and in East Bangalore 36,900 out of 48,908 women are not working. The Bangalore map shows the data visually. Per unit is 20,000 non working women.
The datas per areas are as follows:
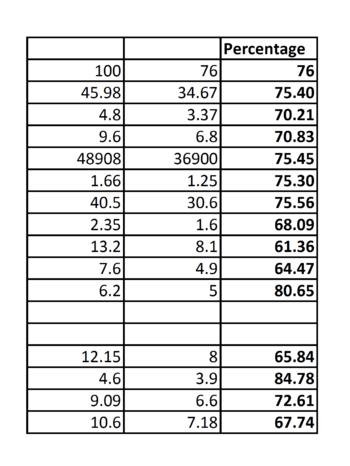
I have taken out the percentage of total non working women according to the data found for a better understanding:
These datas made me realise that we need to motivate women to work . Bangalore being such a large city with so much population is lacking in matter, especially in rural areas.
Line chart
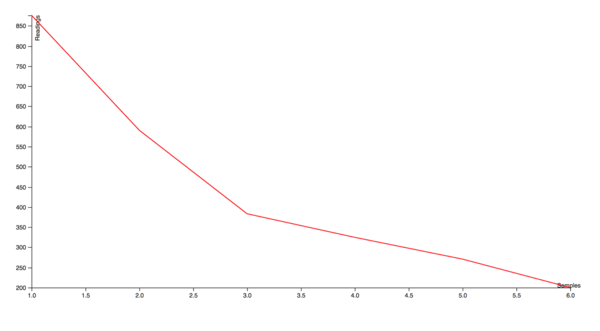
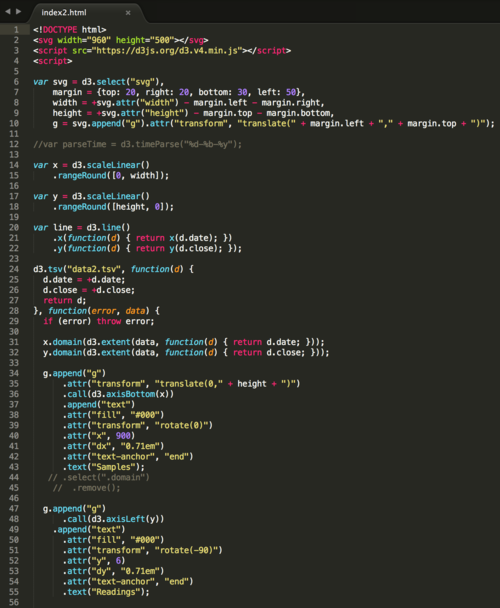
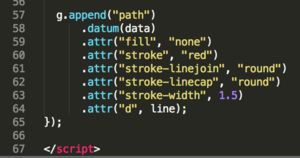
A line chart was created using D3.js. It was the first time when I was working with html. I downloaded Sublime Text and saved coding as index.html and datas as data.tsv. Initially, I didn't understand the coding but with some help, I managed to get the Turbidity Meter serial monitor reading in the form of a Line Chart.
The coding is as follows:
Processing Graph through LDR
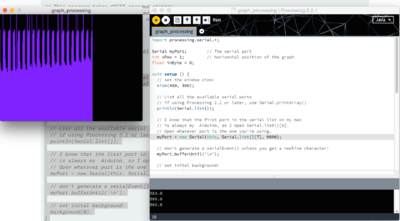
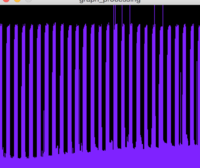
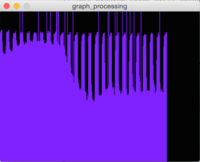
I did the connections of LDR, connecting one end of the resistor with ground, one with 5v and the middle with the analog output. By using the processing graph code, the LDR readings were seen on the screen as a graph. There was a separate code for Processing and Arduino. The graph came according to the light getting detected onto LDR. The pattern in the graph looked interesting.
Coding
Blinking LED number of times
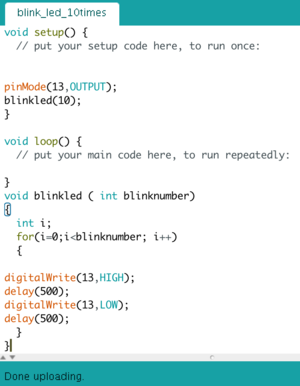
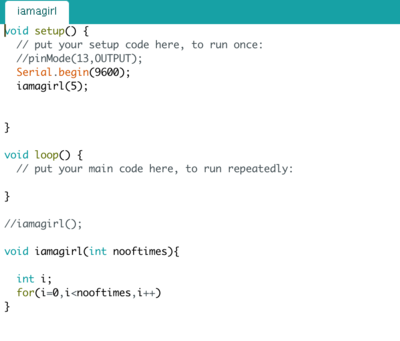
We learnt different codes today. First task was to write something which gets repeated the number of times we want it to. I wrote 'I am a girl' which when given the command, the line displays on serial monitor. In the second task, we had to blink LED five times by writing the code which is shown below. I understood the code properly but there was a problem in writing it myself.
Serial monitor asking how many times we want LED to blink
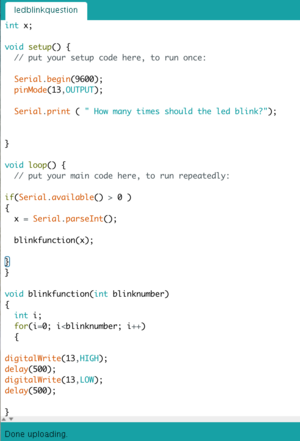
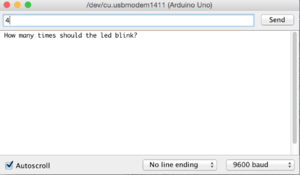
In this, the code is such that when uploaded , the serial monitor asks us a question and when we manually give the command, the LED blinks that many times.
Leds controlled through a sensor
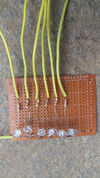
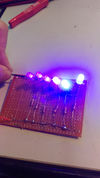
We learnt soldering in this task, I had connected the leds to potentiometer, so as the resistance increases, the glow of LEDs will changes.
An Interactive fun house
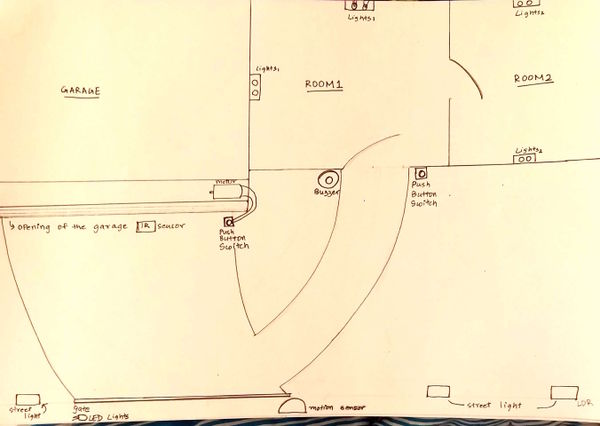
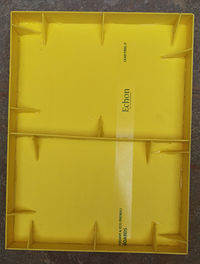
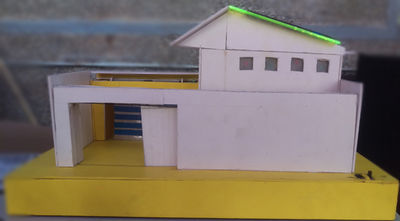
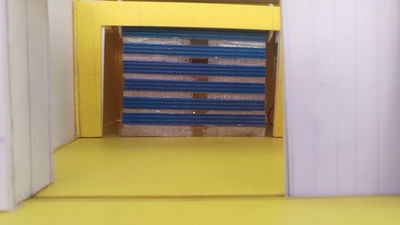
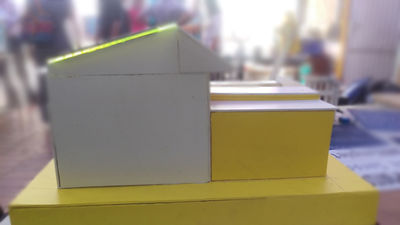
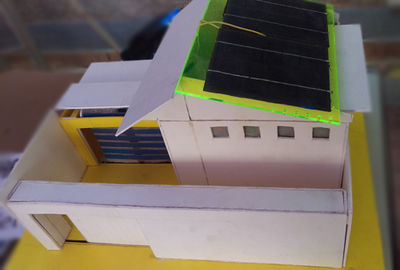
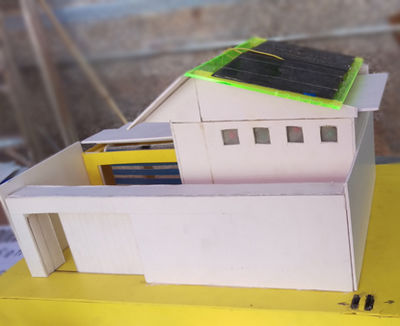
The aim of this project was to make an interactive house for children of age 2-5. There are few mechanisms which were controlled through switches and sensors like the gate of the house, shutter of the garage and the lights of the house.
I had thought of various ideas before coming to this, one was to make a robot which can translate languages, a lock mechanism for the house, then we finally ended up with the interactive house.
We started with making the outer structure
We started by planning the placement and structure of the house, the measurements and the mechanisms. Later, we did the coding part to add a motion sensor and IR sensor for the gate and the garage respectively.
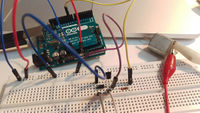
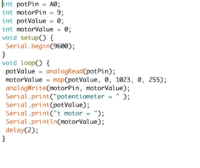
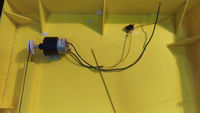
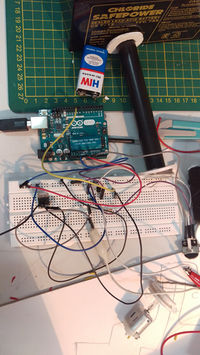
We connected the DC motor to arduino, using transistor and diode. Later added potentiometer to it, to control the speed. Connected the mechanism to the switches, to rotate the motor in clock and anti- clock direction. The codes are as follows:
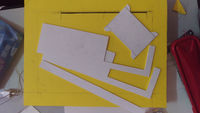
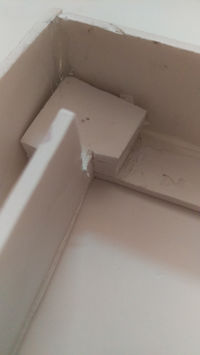
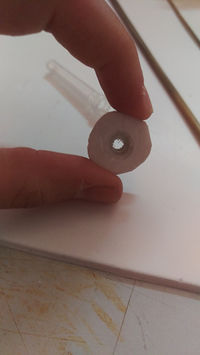
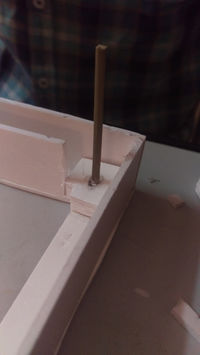
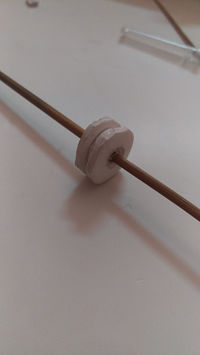
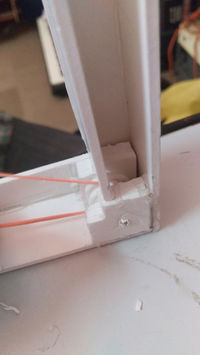
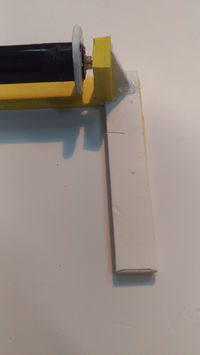
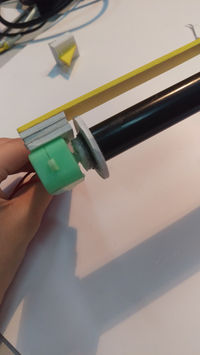
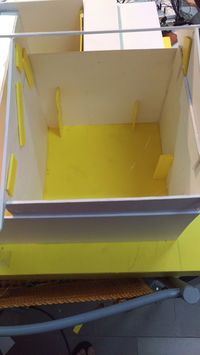
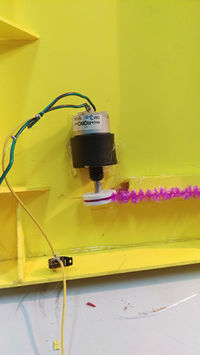
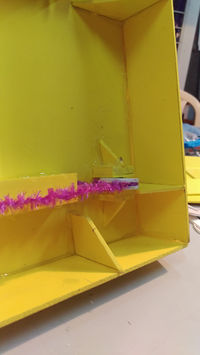
The mechanism is as follows. We had great difficultly to figure it out, made pulleys on both sides, tried different types of threads to check which worked perfectly.The mechanism even broke thrice and doing it several times, made me understand the kinds of problems every time and I could learn through it. We made the entire structure with mount-board.
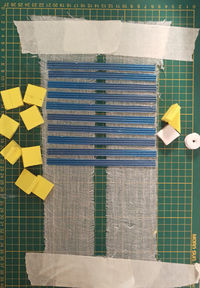
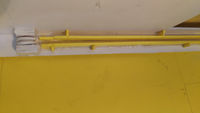
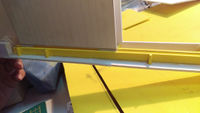
We made the shutter of the garage with strips of paper and bandage.
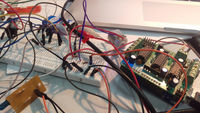
We further added the switch, instead of IR sensor. I had a hard time figuring out the motor shield as the output of the IR sensor had to be connected with the input of motor shield, which didn't workout unfortunately.
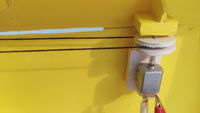
But the DC motor didn't get enough voltage so, we had to connect it through a 12V battery.
Solar panels , 12 V each were connected to the LEDs for the house. Whenever kept in the sunlight, the LED glows.

