Difference between revisions of "Shriya Rathi"
Shriya rathi (Talk | contribs) (→ECG Meter) |
(→Final Project) |
||
| (39 intermediate revisions by 2 users not shown) | |||
| Line 74: | Line 74: | ||
[[File:ECG Arduino Coding.jpeg|700px]] | [[File:ECG Arduino Coding.jpeg|700px]] | ||
| − | Attach the 3 Electrodes to the body. Click on serial monitor to get the readings. | + | |
| + | Attach the 3 Electrodes to the body. Click on serial monitor to get the readings. [[File:Capture.PNG]] | ||
[[File:Ecg2.jpg|100px|thumb|left|user test]] | [[File:Ecg2.jpg|100px|thumb|left|user test]] | ||
==== Reflection ==== | ==== Reflection ==== | ||
To join the circuit of an ECG sensor was easier than I thought. We looked up online for the reference of the connection and the code. In no time we could figure the circuit and it was working. We user tested the electrodes on the hand wrist to get the readings. The part we got stuck was to understand the reading of the ECG meter. The online manual said we needed to download different processing software to see the heart rate graphs. | To join the circuit of an ECG sensor was easier than I thought. We looked up online for the reference of the connection and the code. In no time we could figure the circuit and it was working. We user tested the electrodes on the hand wrist to get the readings. The part we got stuck was to understand the reading of the ECG meter. The online manual said we needed to download different processing software to see the heart rate graphs. | ||
| + | |||
| + | |||
=== Turbidity Meter === | === Turbidity Meter === | ||
==== What is Turbidity Meter and how to build it ==== | ==== What is Turbidity Meter and how to build it ==== | ||
Turbidity is the cloudiness or haziness of a fluid caused by large numbers of individual particles that are generally invisible to the naked eye. Turbidity meter is used to measure the water clarity, the amount of suspended sediment in water which blocks light. | Turbidity is the cloudiness or haziness of a fluid caused by large numbers of individual particles that are generally invisible to the naked eye. Turbidity meter is used to measure the water clarity, the amount of suspended sediment in water which blocks light. | ||
| − | + | [[File:Box.jpg|200px|thumb|right|inside the box]] | |
'''Hardware Required''' | '''Hardware Required''' | ||
#Arduino Uno | #Arduino Uno | ||
| Line 149: | Line 152: | ||
== Beyond Electronics == | == Beyond Electronics == | ||
| + | Beyond electronics deals with the sensors, probes and detectors which are existing in the environment, alive. It doesn't involve any technicality or electronics. For example, body hair that standing up which we commonly call as goosebumps, touch me not plants, glow in the dark worms, planton, algae, etc. | ||
| + | |||
| + | We saw a few example of bio design projects which combined sensors and art together to form interesting outcomes. Spoke about Judaag sensor, a water quality map which detects the levels of Fluoride, Nitrate, Location Type, Turbidity, Ph, Iron. Later half, we looked up to the water samples collected from the Puttenhalli Lake and saw each of its turbidity and microscopic view of living things present in it. One interesting experiment we did was putting a drop of dirty lake water in the slide under the microscope and adding a drop of hand sanitizer. The result was all the micro organisms present were fighting for their life and died eventually. | ||
| + | |||
| + | [[File:11.jpg]] [[File:22.jpg|175px]] [[File:33.jpg|175px]] | ||
| + | |||
| + | == Bangalore graph == | ||
| + | City- Bangalore, Karnataka. Location- Whitefield road. Year- 2006-11 | ||
| + | |||
| + | Statistics of air pollutants generated in the city. Mainly Sulfur dioxide, nitrogen oxides and Respirable Suspended Particulate Matter. | ||
| + | |||
| + | [[File:333.jpg|300px]] | ||
| + | |||
| + | == Line Graph == | ||
| + | Turbidity meter serial monitor reading in line graph.<br> | ||
| + | Coding for line graph in brackets and the outcome. | ||
| + | |||
| + | [[File:Line graph code.png|300px]] [[File:Graph with java script.png|300px]] | ||
| + | |||
| + | == Digital representation of LDR readings == | ||
| + | After connecting an LDR to the arduino and doing the following coding, the readings of the serial monitor started creating patterns. Different amount of light on LDR gave different patterns which was playful to do and artistic to look at. | ||
| + | |||
| + | Arduino Code | ||
| + | |||
| + | [[File:Arduino code.png|300px]] | ||
| + | |||
| + | Processing Code | ||
| + | |||
| + | [[File:Processing code.png|300px]] | ||
| + | |||
| + | Serial Monitor readings | ||
| + | |||
| + | [[File:Arduino serial monitor.png|300px]] | ||
| + | |||
| + | Graphical Representation | ||
| + | |||
| + | [[File:Graphh.png|300px]] | ||
| + | |||
| + | == Coding for the following == | ||
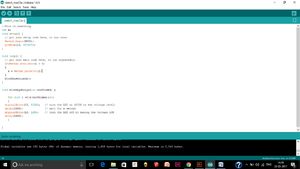
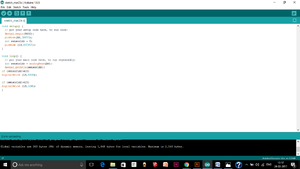
| + | This task was based on learning coding. We started with printing something on the serial monitor. After writing the sentence I wanted to print and learning how to write the coding for the number of times I want the monitor to print my writing, I saw everything was coming in the same line horizontally. Then I figured adding "ln" to Serial.print which gives Serial.println will make the outcome write in vertical lines. Figuring out everything step by step made me understand the coding in a better way than learning everything at once. | ||
| + | |||
| + | === Make an LED blink 5 times === | ||
| + | |||
| + | [[File:Blink 5 times.png|300px]] | ||
| + | |||
| + | === Command given by Serial Monitor === | ||
| + | |||
| + | [[File:Task2.png|300px]] | ||
| + | |||
| + | === LED blink according to LDR value === | ||
| + | |||
| + | [[File:Ldr code with led blink.png|300px]] | ||
| + | |||
| + | ==EMF Sensor== | ||
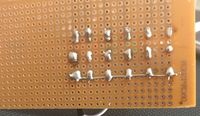
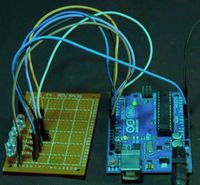
| + | An EMF meter can measure electromagnetic fields. To make the EMF sensor, we connected 6 LEDs with resistors and learnt how to solder. Then after some help and understanding, I connected just one wire to the input pin of the arduino and the rest were connected to the output for the LEDs to blink. | ||
| + | |||
| + | [[File:Solder.jpg|200px]] [[File:Emf.jpg|200px]] | ||
| + | |||
| + | ==Final Project== | ||
| + | ===SELF WATERING PLANTER=== | ||
| + | A Self Watering Planter is a pot for house plants designed in a way that it will water itself when it feels like drinking. Taking moisture level into account, it will water itself when there is less moisture in soil. In a way, the pot is the communication link between human and plants as we don't how much water is required by them and when. We, humans, water the plants as and when we remember or fix a particular time which might not be convenient time for the plants. Also, save water and grow healthier veggies and flowers with a self-watering planter. | ||
| + | |||
| + | ====Functions of the Planter==== | ||
| + | # The planter waters itself when there is low moisture content in soil. | ||
| + | # Says out loud when it needs water or when it doesn't depending on the moisture content. | ||
| + | # Indication of the amount of moisture level using LEDs. | ||
| + | |||
| + | ====Hardware Used==== | ||
| + | Moisture sensor<br> | ||
| + | Text to Speech module<br> | ||
| + | Servo motor<br> | ||
| + | Arduino Uno<br> | ||
| + | LEDs<br> | ||
| + | Resistors<br> | ||
| + | Speakers<br> | ||
| + | Wires<br> | ||
| + | |||
| + | ====Connections==== | ||
| + | [[File:Final connections.jpg|500px]] | ||
| + | |||
| + | ====Coding==== | ||
| + | The following is the coding for the Self watering planter in 3 parts.<br> | ||
| + | Part 1, Part2, Part3 | ||
| + | |||
| + | [[File:Final coding1.jpg|300px]] [[File:Final coding2.png|300px]] [[File:Final coding 3.png|300px]] | ||
| + | |||
| + | ====Prototype==== | ||
| + | The final product in which the servo motor is helping the water to flow from the right container. | ||
| + | |||
| + | [[File:Prototype.jpg]] | ||
| + | |||
| + | ==== Details of the prototype ==== | ||
| + | |||
| + | [[File:1.1.jpg|200px]] [[File:1.3.jpg]] [[File:1.2.jpg]] | ||
Latest revision as of 15:40, 11 April 2017
Contents
Prelude
About me
Hi, I am Shriya, currently learning Industrial Design from Srishti Institute of Art, Design and Technology. I aspire to be a Product Designer and so I feel it is important to have learnt some basic information about electronics and technology. This thought of coming out from the comfort zone and learning science pulled me towards this course. Coming from a commerce background, I did not have good knowledge of physics. I knew I was entering the class with a blank mind hoping to learn how things work in the world of technology.
Introduction to basics
As the day started, we got introduced to the arduino software (works with C++ language) which can communicate with the arduino electronic plate and can interact with the things attached to it. To my understanding, the digital side is for the output and analog side is for the input.
Sensors
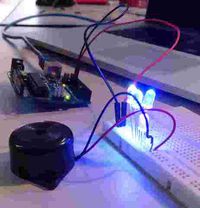
I looked closely to the basic things that can be attached to arduino, processed and had an outcome. We, in groups, touched our hands on LED (light emitting device), jumper wires, buzzer,LDR (Light Dependent Resistor), bread board and played around by putting one leg on ground, one on the digital side, changing the values and getting different results. Learnt the functions of a bread board which is used for prototyping connections, potentio meter with three legs and soldering the connections. Sitting in a helped us share each other’s knowledge and mistakes.
Series Connection
The current in a series circuit goes through every component in the circuit. Therefore, all of the components in a series connection carry the same current. There is only one path in a series circuit in which the current can flow. The total resistance of resistors in series is equal to the sum of their individual resistances. If we have to increase the resistance in a circuit, use series connection. For example, in a fairy light, the connection is a series connection. If one LED out of the many in the row looses its connection, all the other lights stops working.
Parallel Connection
The current in each connected branch line is different. The total current is the sum of the currents through the individual components. In parallel connection, the heads of the resistors are connected together and the tails are connected together. This decreases the total resistance of the circuit. For example, if 3 bulbs are connected together in a parallel connection and stops working due to loose connection, the other two bulbs will still work as the current flowing in each branch line is different.
Capacitors
A capacitor is a device use to store electric charge like a small rechargeable battery. The effect of a capacitor is known as capacitance.
Field visit
Puttenahalli Lake, Yelahanka
Purpose of Visit
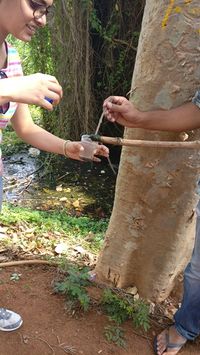
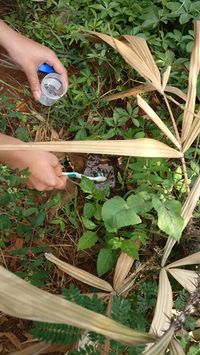
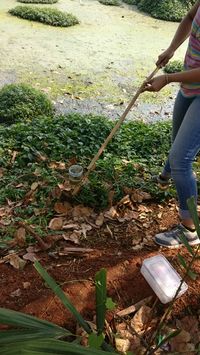
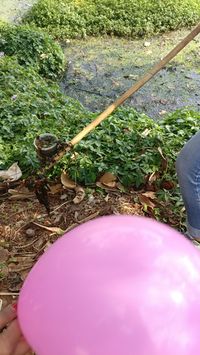
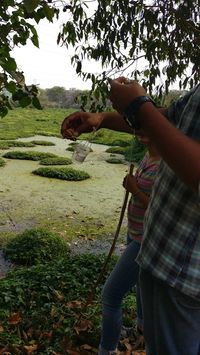
First visit to Puttenahalli Lake was scheduled on 7th march to collect lake water and rain water. A kit was prepared of the things we will need for the collection of water and documentation like closed containers, tissues, brush, labels, clean water, dropper, threads etc. We collected 8 different samples of water from different layers using ladle, threads, stone for weight so that the container touch the deeper layers of lake water and manually pouring it. The purpose of collecting lake water was to study its components and find diatoms in it.
Reflection
We had to do quite a few attempts to get the desired water. While gathering the water and soil samples, we realized we have forgotten some useful things in the kit. I noticed a pre-planing to the trip was required which we had done in class as to what kind of sample we want, sample from the shade, sample where water meets sunlight, rain water sample and different layers of water sample. It was a nice environment with birds and dogs accompanying and a good learning on how to collect samples for lab tests.
Projects
Touch me not monster
Brief
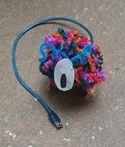
Touch me not monster is child's play which crawls when touched at a particular point repeatedly.
This piece was built using- arduino uno
- 2 servo motors
- IR sensor
The two servo motors are attached together in a way that both the rotating fan are opposite each other connecting it to and arduino uno and an IR sensor.
Reflection
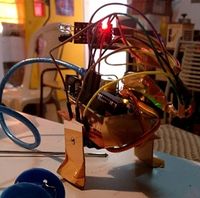
Being at a learner’s stage, I was trying to understand how 2 or more than 2 sensors and motors are connected together with respect to its coding. Learnt how to solder and worked on covering the wire structure. To hide the technical part, we connected the monster’s legs to the rotating fan of the servo motor and made the body using some colourful thick threads.
ECG Meter
Instructions on how to use an ECG sensor
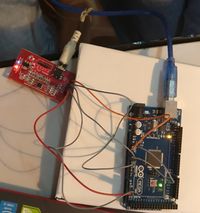
ECG Meter is a device used to monitor the continuous heart activity of a patient in relative to their cardiac rhythm. Hardware required
- Arduino Mega
- ECG sensor board
- ECG Electrodes - 3 pieces
- ECG Electrode Connector -3.5 mm
- Power supply
- Connecting Wires
Connection of ECG sensor with Arduino- The ECG sensor comes with 9 pins. 6 pins for input connections and 5 pins to connect Electrodes. The input connections are as follows-
  Board Label	Pin Function         Arduino Connection
  GND	        Ground	             GND
  3.3v	        3.3v Power Supply    3.3v
  OUTPUT	Output Signal	     A0
  LO-	        Leads-off Detect -   11
  LO+	        Leads-off Detect +   10
  SDN	        Shutdown	     Not used
We already have an external cable connecting all the three parts of electrodes so we directly plug it in.
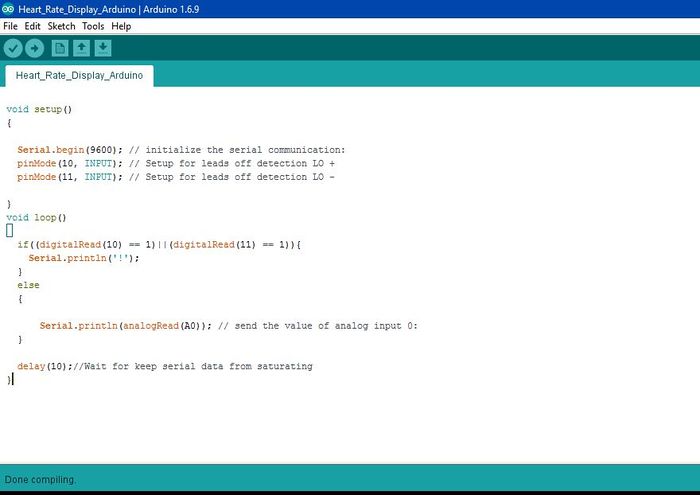
Coding- Select the arduino mega board, follow the coding and upload. Change the values according to the requirement. image
Attach the 3 Electrodes to the body. Click on serial monitor to get the readings. 
Reflection
To join the circuit of an ECG sensor was easier than I thought. We looked up online for the reference of the connection and the code. In no time we could figure the circuit and it was working. We user tested the electrodes on the hand wrist to get the readings. The part we got stuck was to understand the reading of the ECG meter. The online manual said we needed to download different processing software to see the heart rate graphs.
Turbidity Meter
What is Turbidity Meter and how to build it
Turbidity is the cloudiness or haziness of a fluid caused by large numbers of individual particles that are generally invisible to the naked eye. Turbidity meter is used to measure the water clarity, the amount of suspended sediment in water which blocks light.
Hardware Required
- Arduino Uno
- Light source- LED (Light Emiting Diode)
- LDR sensor(Light Dependent Resistor)
- Resistor
- Connecting wire
- Switch button
Connecting LED- Bigger leg to 13 and smaller one to the ground.
Connecting LDR- Make a third leg of the LDR using a resistor. Connect the first leg to the power of 5v, centre to A0 and last to the ground.
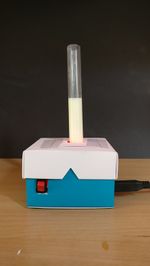
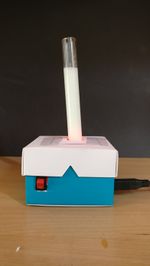
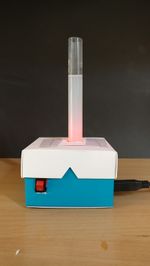
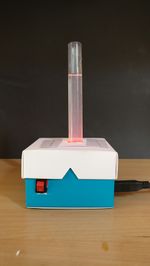
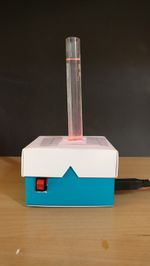
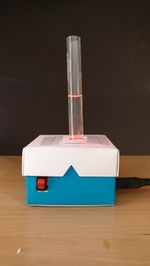
The meter works when LED and LDR face exactly each other with a gap in between for the sample to be placed. It gives the reading on the basis of the amount of light that travels between the water sample and reaches to LDR. More the light, more clear the water and vice versa. Attach a switch to the LED for the device to turn on and off.
Coding
Sample
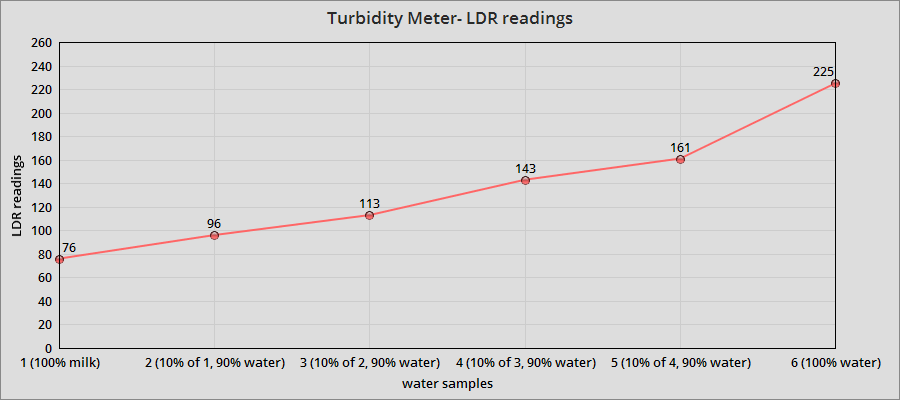
6 samples were used to test the turbidity meter.
sample 1- 100% milk
sample 2- 10% of sample 1 and 90% water
sample 3- 10% of sample 2 and 90% water
sample 4- 10% of sample 3 and 90% water
sample 5- 10% of sample 4 and 90% water
sample 6- 100% water
Graph Graph from the readings of 6 samples
Reflection
Initially, the reading range was in between 0 to 8 which did not make a major difference in two samples. Then, we altered the connections of the LDR and we could see the readings in hundreds. Another decision we had to make was to which color LED to use. we chose to use red because it travels in a straight path with less deviation. Soldering was a bit difficult and fun as it was my first attempt to make a complete soldered circuit. To cover the connections, we used a neat and nice looking cosmetic box, made holes for the test tube samples to go in and switch to come out. Due to these holes, there wasn't 100% darkness inside the box so I had to cut the holes with precision again. But later after measuring the samples, I understood that difference between the reading without the sample and with the sample gives the accurate measure. Overall, I started the understanding of sensors from scratch and now I have a little bit of confidence in me that i can work with it and understand what is going wrong and where.
Activity
Draw what you think
Cyborg
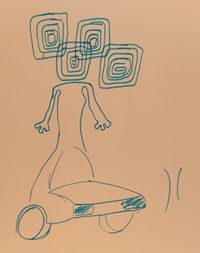
Cyborg means half human half machine. Initially, while drawing I didn't know what a Cyborg was but it sounded techie so I tried drawing human using technology.
Post Human
Post Human, to me, means a person who exists beyond being human. An entity which had derived as an outcome of evolution. As it is an evolution of human, there will remain some parts like limbs, may be, from the body of a human being.
Future Gadget
Futuristic Mask
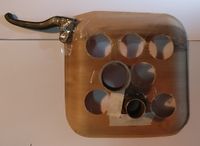
In this activity, we had to collect the waste and discards and build a sensor which will exist 10 years from now. The Mask will take away the foul smell and help you breathe whatever fragrance you want. Also it will help click pictures and enjoy the moment at the same time as the lens will be located little upward from the eye level.
Beyond Electronics
Beyond electronics deals with the sensors, probes and detectors which are existing in the environment, alive. It doesn't involve any technicality or electronics. For example, body hair that standing up which we commonly call as goosebumps, touch me not plants, glow in the dark worms, planton, algae, etc.
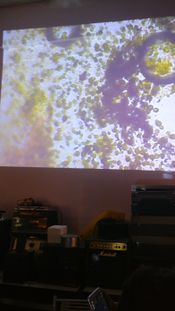
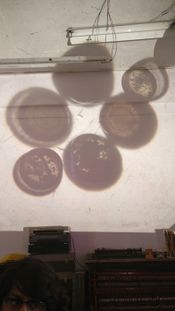
We saw a few example of bio design projects which combined sensors and art together to form interesting outcomes. Spoke about Judaag sensor, a water quality map which detects the levels of Fluoride, Nitrate, Location Type, Turbidity, Ph, Iron. Later half, we looked up to the water samples collected from the Puttenhalli Lake and saw each of its turbidity and microscopic view of living things present in it. One interesting experiment we did was putting a drop of dirty lake water in the slide under the microscope and adding a drop of hand sanitizer. The result was all the micro organisms present were fighting for their life and died eventually.
Bangalore graph
City- Bangalore, Karnataka. Location- Whitefield road. Year- 2006-11
Statistics of air pollutants generated in the city. Mainly Sulfur dioxide, nitrogen oxides and Respirable Suspended Particulate Matter.
Line Graph
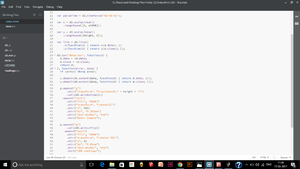
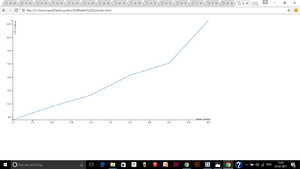
Turbidity meter serial monitor reading in line graph.
Coding for line graph in brackets and the outcome.
Digital representation of LDR readings
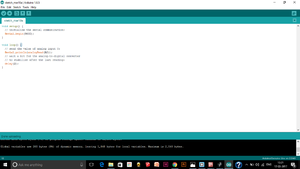
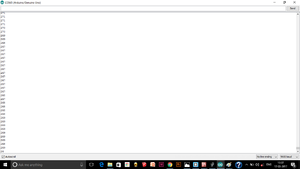
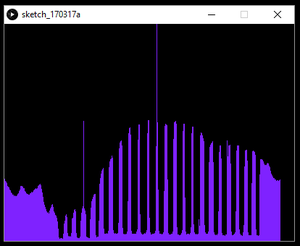
After connecting an LDR to the arduino and doing the following coding, the readings of the serial monitor started creating patterns. Different amount of light on LDR gave different patterns which was playful to do and artistic to look at.
Arduino Code
Processing Code
Serial Monitor readings
Graphical Representation
Coding for the following
This task was based on learning coding. We started with printing something on the serial monitor. After writing the sentence I wanted to print and learning how to write the coding for the number of times I want the monitor to print my writing, I saw everything was coming in the same line horizontally. Then I figured adding "ln" to Serial.print which gives Serial.println will make the outcome write in vertical lines. Figuring out everything step by step made me understand the coding in a better way than learning everything at once.
Make an LED blink 5 times
Command given by Serial Monitor
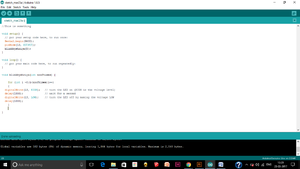
LED blink according to LDR value
EMF Sensor
An EMF meter can measure electromagnetic fields. To make the EMF sensor, we connected 6 LEDs with resistors and learnt how to solder. Then after some help and understanding, I connected just one wire to the input pin of the arduino and the rest were connected to the output for the LEDs to blink.
Final Project
SELF WATERING PLANTER
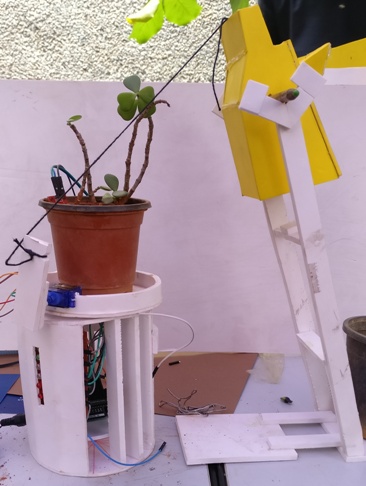
A Self Watering Planter is a pot for house plants designed in a way that it will water itself when it feels like drinking. Taking moisture level into account, it will water itself when there is less moisture in soil. In a way, the pot is the communication link between human and plants as we don't how much water is required by them and when. We, humans, water the plants as and when we remember or fix a particular time which might not be convenient time for the plants. Also, save water and grow healthier veggies and flowers with a self-watering planter.
Functions of the Planter
- The planter waters itself when there is low moisture content in soil.
- Says out loud when it needs water or when it doesn't depending on the moisture content.
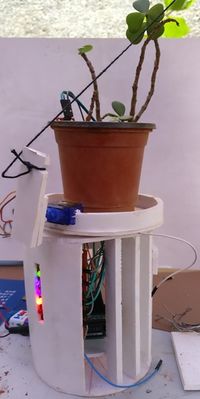
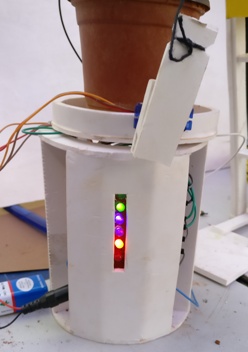
- Indication of the amount of moisture level using LEDs.
Hardware Used
Moisture sensor
Text to Speech module
Servo motor
Arduino Uno
LEDs
Resistors
Speakers
Wires
Connections
Coding
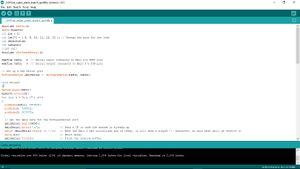
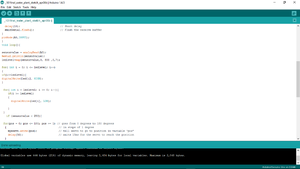
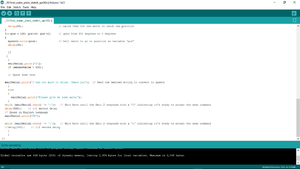
The following is the coding for the Self watering planter in 3 parts.
Part 1, Part2, Part3
Prototype
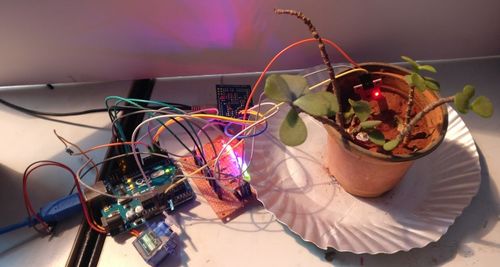
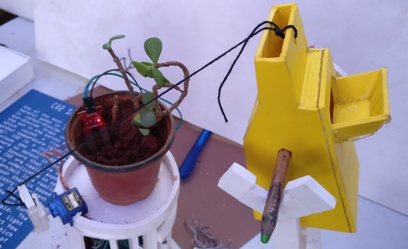
The final product in which the servo motor is helping the water to flow from the right container.
