Difference between revisions of "Meera Sanghani"
(→Data Logging for Arduino) |
(→Data Logging for Arduino) |
||
| Line 119: | Line 119: | ||
I recorded the LDR readings and plotted them. | I recorded the LDR readings and plotted them. | ||
| − | [[File:Screenshot (414).png| | + | [[File:Screenshot (414).png|200px]] |
| − | [[File:Ldrgraph.png| | + | [[File:Ldrgraph.png|600px]] |
===Arduino Shield=== | ===Arduino Shield=== | ||
Revision as of 09:52, 27 March 2017
Challenge Accepted
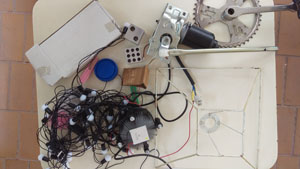
Task:Use motors
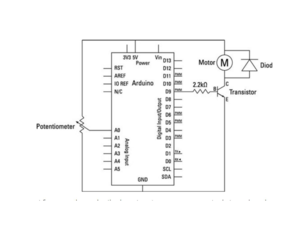
In the previous course the only encounter with motors was using them with a module and arduino. Transistors and diode circuits I hadn't touched upon. I had experimented with Unity and serial communication. I thought of creating something dance oriented but since we weren't having accelerometers but we're using motors there was a change of plans. The LDR circuit couldn't be easily stitched with the diode circuit just like two libraries being fused in the IDE. So we moved ahead with the potentiometer and remade the circuit in a compact format. As a consumer product I feel it can be a valuable addition to an artist's toolset. I expect to figure out the coding back end more smoothly through this course while keeping the sensor interaction simple.
Contents
Sensors
Tilt Sensor
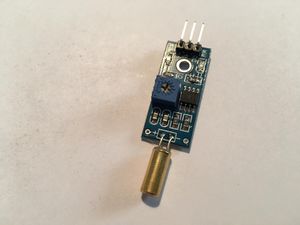
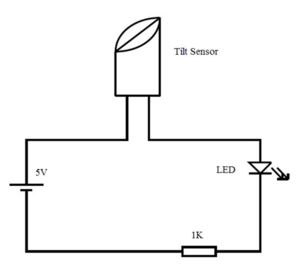
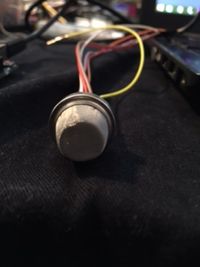
A Tilt Sensor or a Tilt Switch is a component that detects orientation of an object. There are different types of tilt sensors based on the axes it can measure.
A simple tilt sensor is basically a switch that will turn ON or OFF based angle or orientation of the sensor. Such sensor is useful for single axis tilt detection.
How does it work?
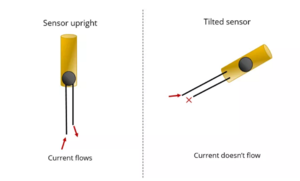
The tilt sensor is cylindrical and contains a free conductive rolling ball inside with two conductive elements (poles) beneath.
When the sensor is completely upright, the ball falls to the bottom of the sensor and connects the poles, allowing the current to flow.
When the sensor is tilted, the ball doesn’t touch the poles, the circuit is open, and the current doesn’t flow.
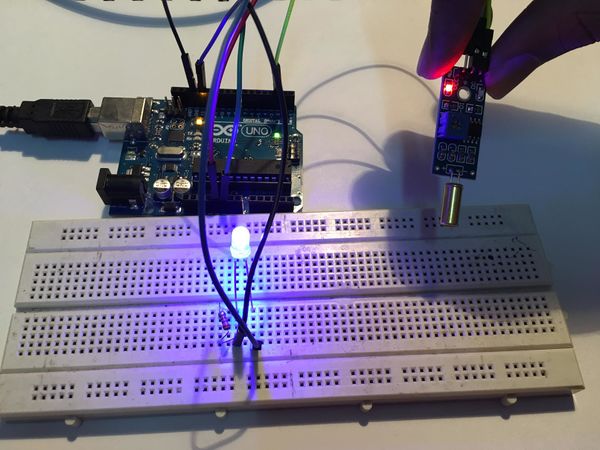
This way, the tilt sensor acts like a switch that is turned on or off depending on its inclination. So, it will give digital information to the Arduino, either a HIGH or a LOW signal. 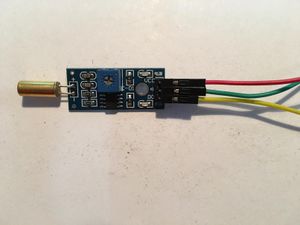
Materials Used
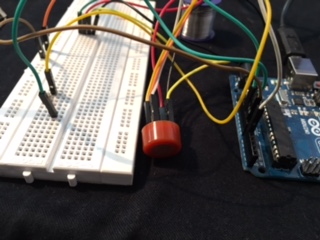
- Arduino,
- Bread board,
- Led/buzzer,
- Tilt sensor module,
- Jumper wires
Turbidity Sensor
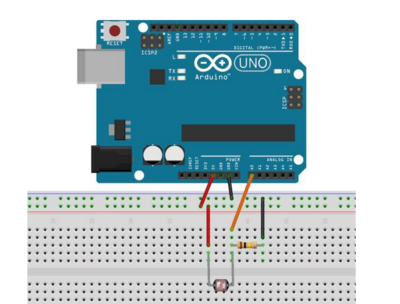
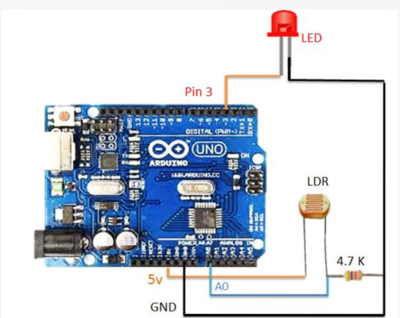
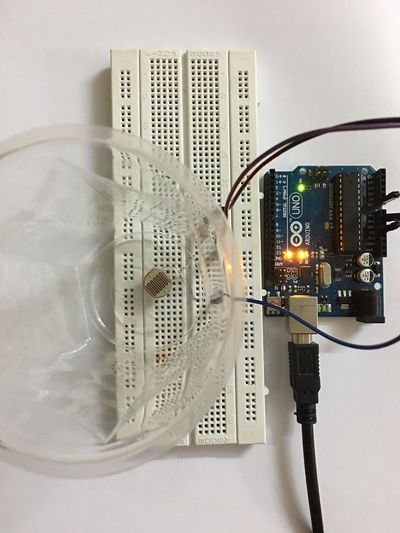
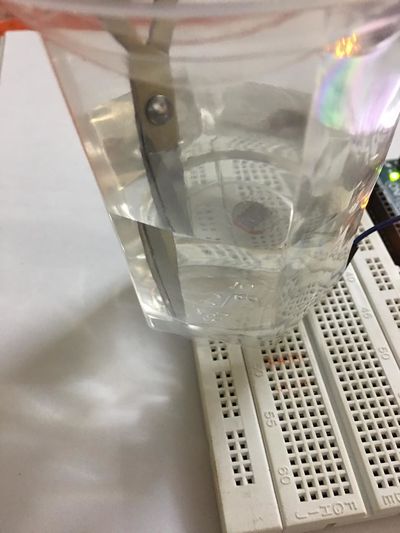
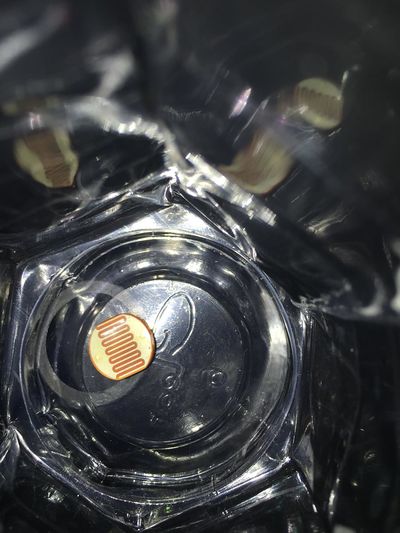
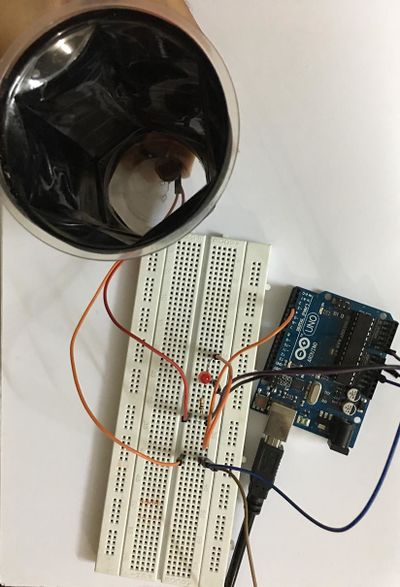
Combining basic LDR circuit with an LED we created a turbidity detector .The essential factor to consider was casing the LDR in darkness.
Circuit
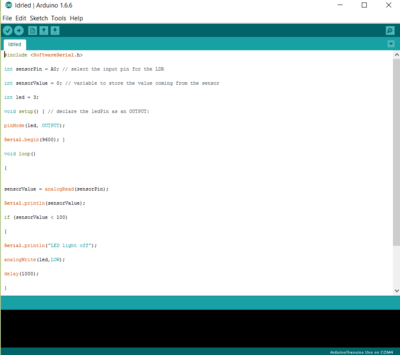
Arduino Code
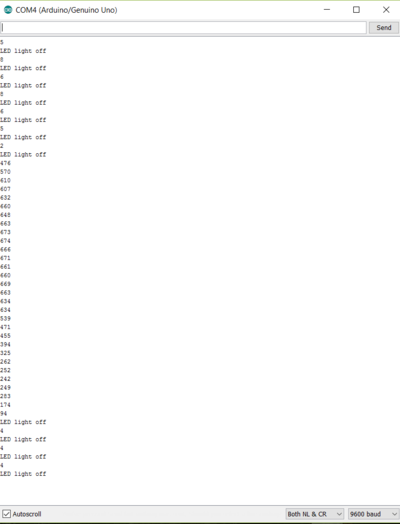
Serial Reading
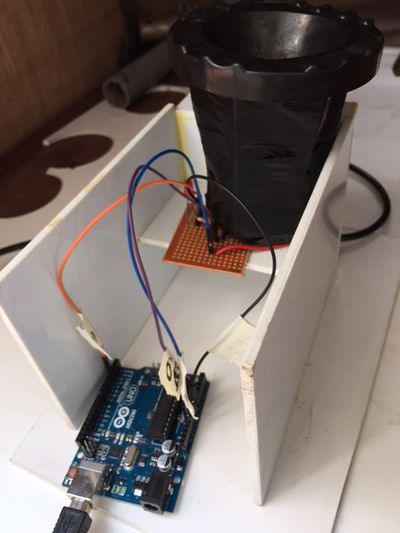
Construction of the meter
Turbidity Meter Calibration
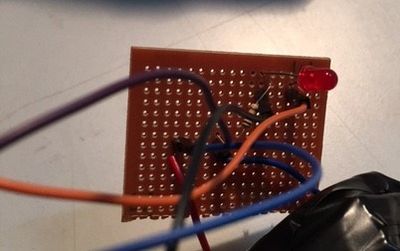
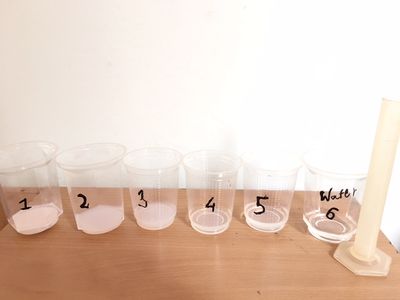
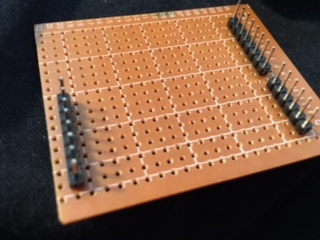
Further, the circuit was soldered on to a PCB and cased with sunboard. Calibrating the meter requires successive dilution of samples. Milk is diluted with water and readings are gathered in a dark area.
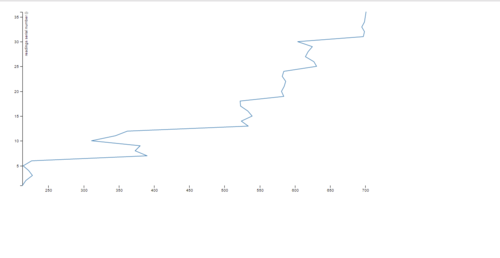
Starting with 25 ml of a sample we did a five fold dilution where the maximum concentration of milk resulted in a reading of approx 220 units and maximum dilution approached 700 units.
The average of serial monitor readings was plotted against level of dilution in the five fold dilution process (starting from 25 on Y axis and going 5 units lesser for the next dilution and so on).

CYBORG
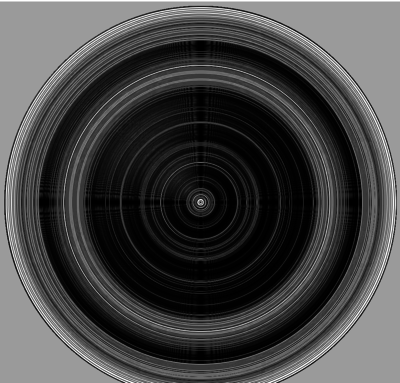
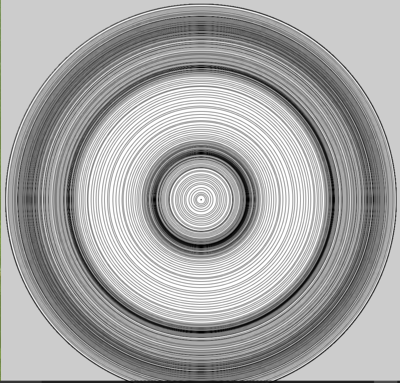
The visualisation depicts the two sides of a cyborg -the emotional and mechanical.The lines are symbolic of mechanical nature on one end and flowy and emotional on the other.The x like structures show the genectic structure while the spiral structure shows the electronic connections.
POSTHUMAN
The visualisation shows the formless,structureless post humans.The image texture is symbolic of soil texture and destruction. It also shows the uncertainity of size and our lens of viewing .
POSTHUMAN CYBORg -ten years from now=
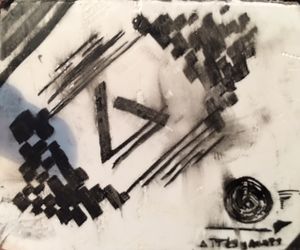
Here, we had to visualise the intersection of the themes: Cyborg and Posthuman 10 years from now.
We visualised the intersection to be a dystopian age where every individual is a brand by 'it'self and is completely self sufficient for survival. The image shows an example of the 'logo ID' of an individual. It would consist of a unique visual as well as a different bar code that is recognized by others and directly installs that brand's unique language into the viewer's perception. These IDs are produced by different private governments who are 'publishers'. They also tailor sensory hacks which 'Hollywood'izes the world in different styles. So, every person sees everything as beautiful through his branded vision.
Database Research
The link gives an access to karnataka mobile number directory.
[1]gives us an access to open bangalore data.
Data Visualization
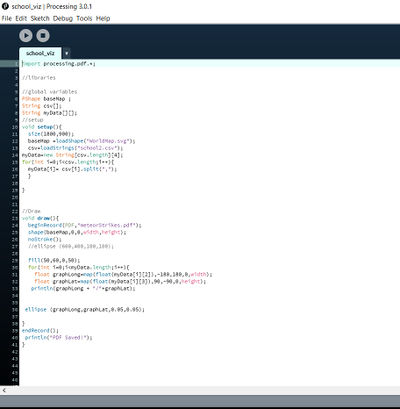
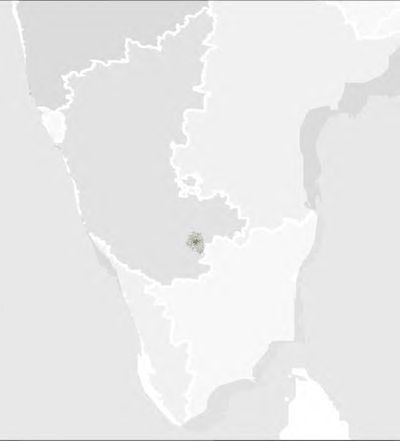
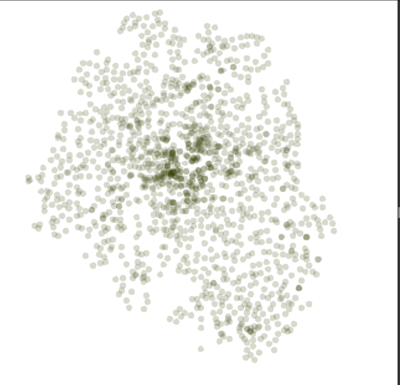
The school data available from open data bangalore was used in processing to plot them in an equirectangular world map.
Line Chart
Using the serial monitor readings from the turbidity meter,a line chart is created in D3.js.
Serial Communication
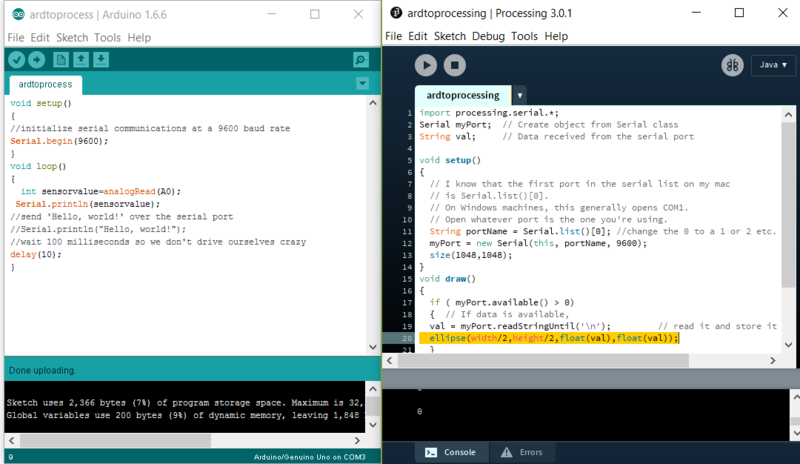
The code below allows us to communicate with arduino and processing.It creates a circle whose radius is controlled by a potentiometer in real time.
Data Logging for Arduino
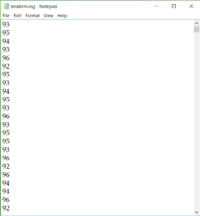
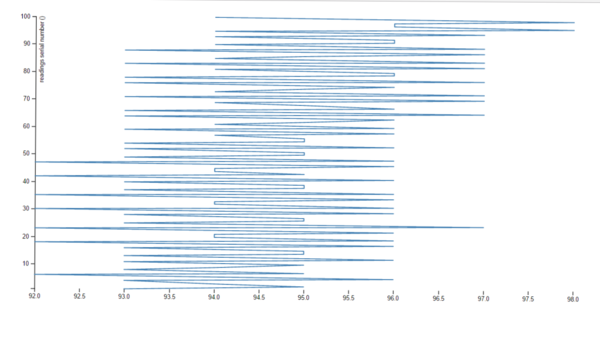
The task at hand was to figure how to save incoming serial data as a text file.This was done using Tera Term One can set the Connection options to the respective Arduino COM port and hit "Connect". This shall start showing the data stream from that port.File-Log allows us to start recording . I recorded the LDR readings and plotted them.
Arduino Shield
